Definitions
Starling's Forces
- The 4 forces involved in determining the net filtration pressure across the capillary membrane
- Capillary hydrostatic pressure (Pc)
- Interstitial hydrostatic pressure (Pi)
- Plasma oncotic pressure (𝝅p)
- Interstitial fluid oncotic pressure (𝝅i)
Preload
- Preload is the initial degree of stretch on the cardiac myocytes just prior to contraction
- Alternatively, it is the load on the myocardium just prior to onset of contraction
- An index of preload can be taken from
- Sarcomere length just prior to contraction
- Left ventricular end diastolic volume
- Left ventricular end diastolic pressure (assumes normal LV compliance)
Afterload
- Afterload is the impedence that the heart must overcome to eject blood into the arterial circulation
- Alternatively, it is the wall tension generated by the left ventricular wall during ejection
- An index of afterload can be taken from
- Mean arterial pressure
- Left ventricular end-systolic pressure
- Systemic vascular resistance
Contractility
- Contractility is the intrinsic ability of cardiac myocytes to generate mechanical power at a given preload and afterload
- Alternatively, it is the factor responsible for changes in myocardial performance which are not due to changes in heart rate, preload or afterload
- Contractility defines the amount of work that the heart can perform, at a given load
- An index of contractility can be taken from
- (dp/dt)max, the maximum rate of pressure change in the left ventricle during isovolumetric contraction
Cardiac Output
- The volume of blood pumped by the heart into the systemic circulation per unit time
Venous return
- The rate of blood flow back to the right side of the heart
Shock
- Shock is state of circulatory failure that results in inadequate organ perfusion and tissue oxygenation
Electrophysiology
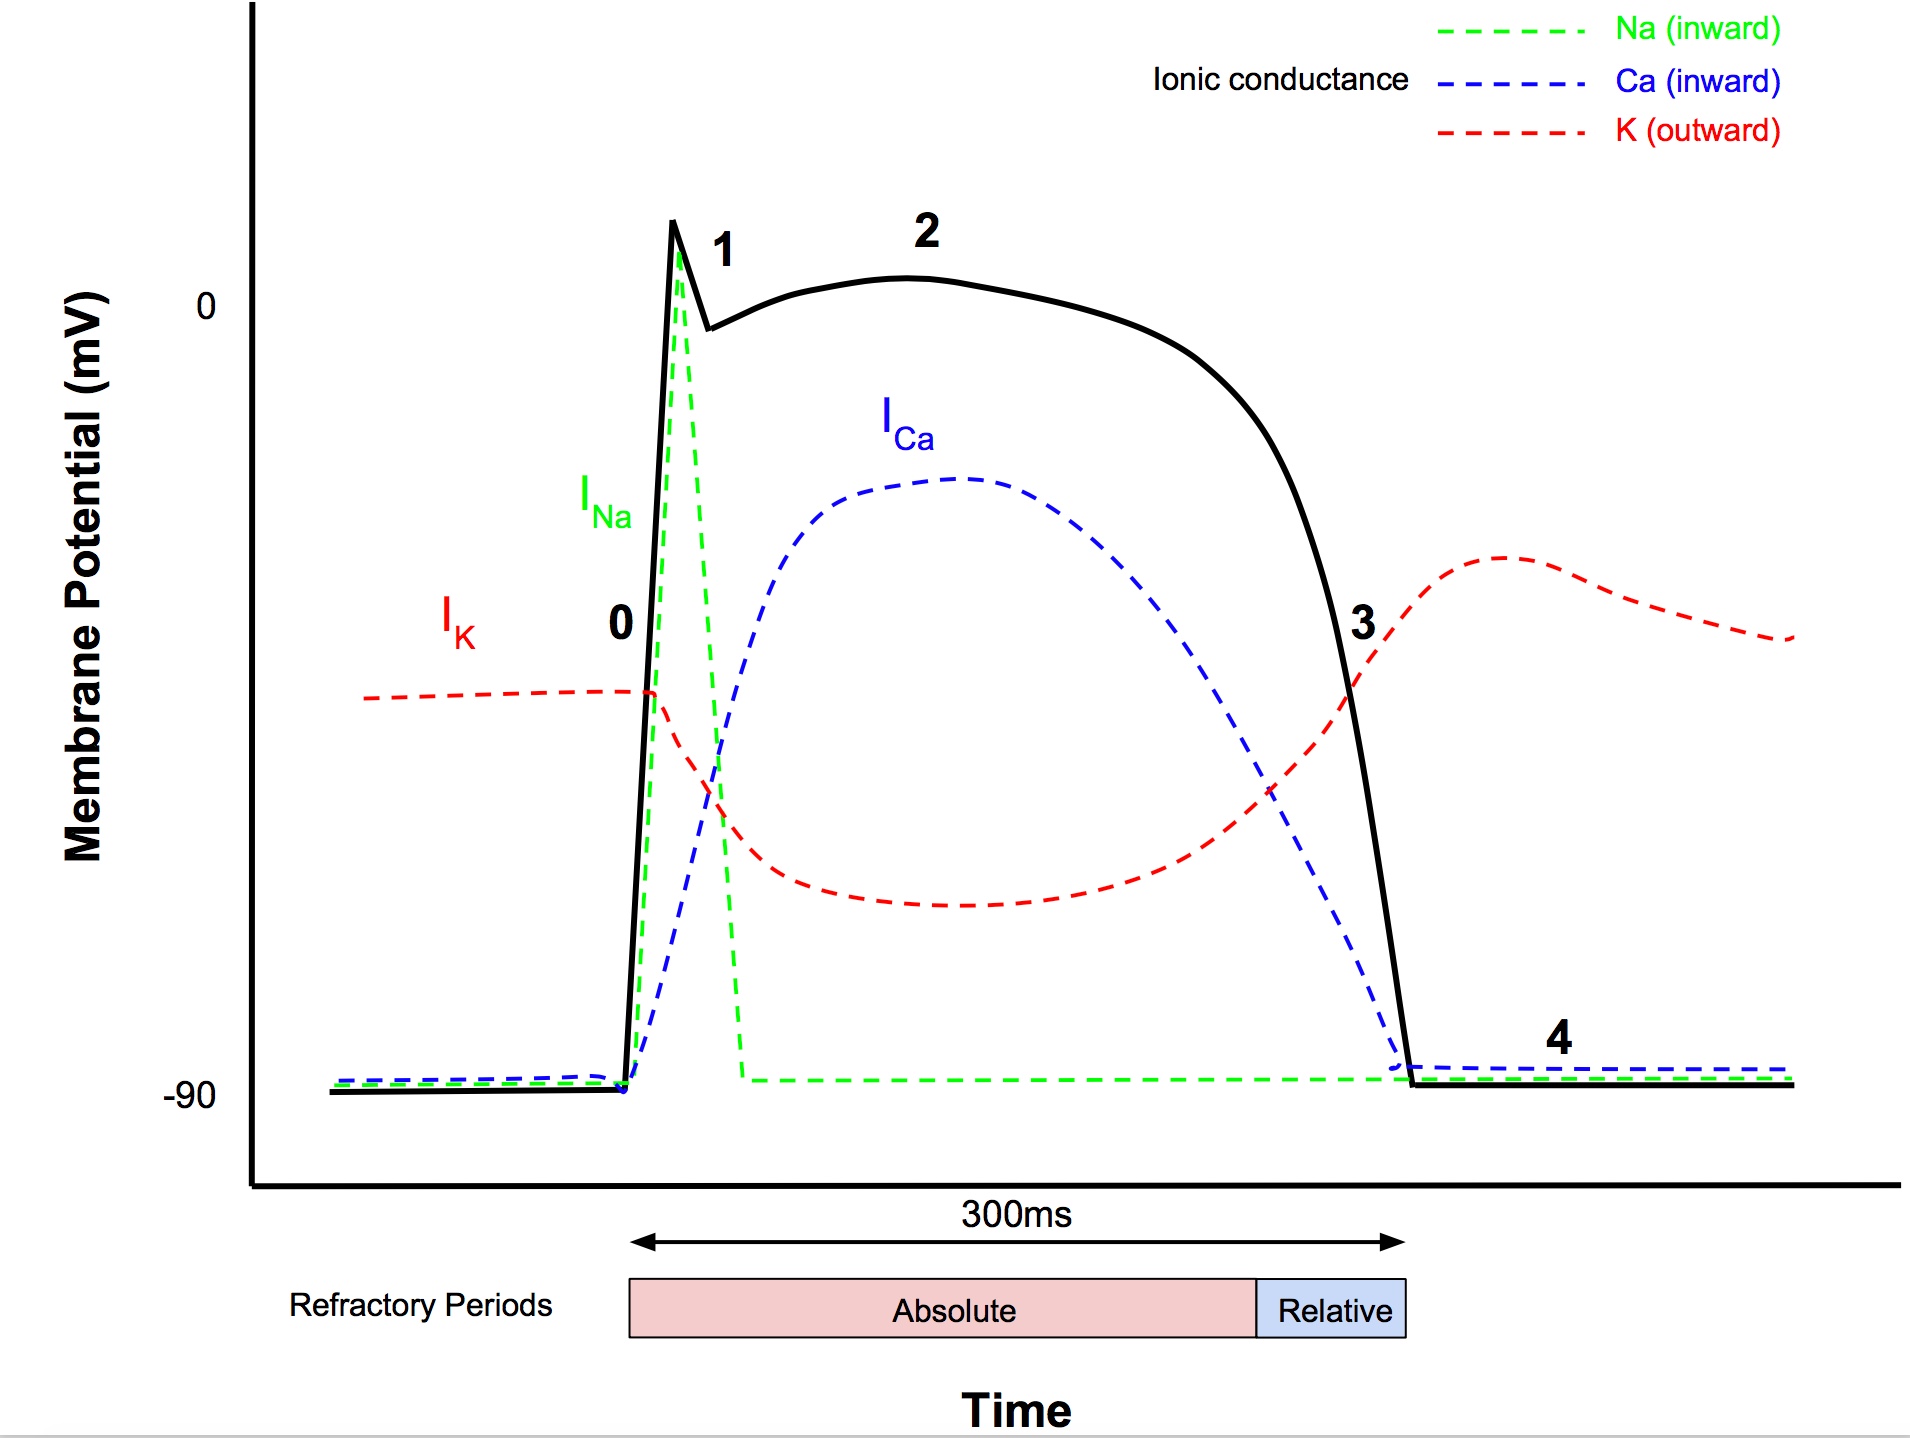
Fast Response Action Potentials
- Occur in
- atrial myocytes
- ventricular myocytes
- Purkinje fibres
- Resting membrane potential -85 to -95mV
- AP magnitude 105mV
- AP duration
- atria 200ms
- ventricles 300ms
- Speed of propagation
- 0.3-1m/s in myocytes
- 1-4m/s in conducting fibers
Phase 0 (Rapid depolarization)
- After reaching threshold (-70mV), Vg Na+ channels open
- Fast sodium current INa produces rapid depolarisation (inward current)
Phase 1 (Early repolarization)
- Vg Na+ channels close
- Outward K+ current via Vg K+ channels causes partial repolarisation
Phase 2 (Plateau)
- Influx of Ca2+ through L-type (long lasting) Vg Ca2+ channels balances efflux of K+
- After start of phase 2, Ca2+ channels start to inactivate
Phase 3 (Final repolarization)
- K+, Na+, Ca2+ permeability return towards normal
- Hence K+ efflux > Ca2+ influx
Phase 4 (Restoration of the RMP)
- Membrane potential returns to resting level
- Ionic concs restored by Na+:K+ ATPase, Na+:Ca2+ exchanger
- Outward K+ current is balanced by the inward Na+ and Ca2+ currents
Refractory Periods
- From start of phase 0 to mid phase 3 is the absolute refractory period, ie a further electrical stimulus cannot elicit another action potential
- During phase 3, the h (inactivation) gates of Vg Na+ channels start to reopen
- When h gates are partially reopened, this starts the relative refractory period, ie a stronger stimulus can evoke depolarisation
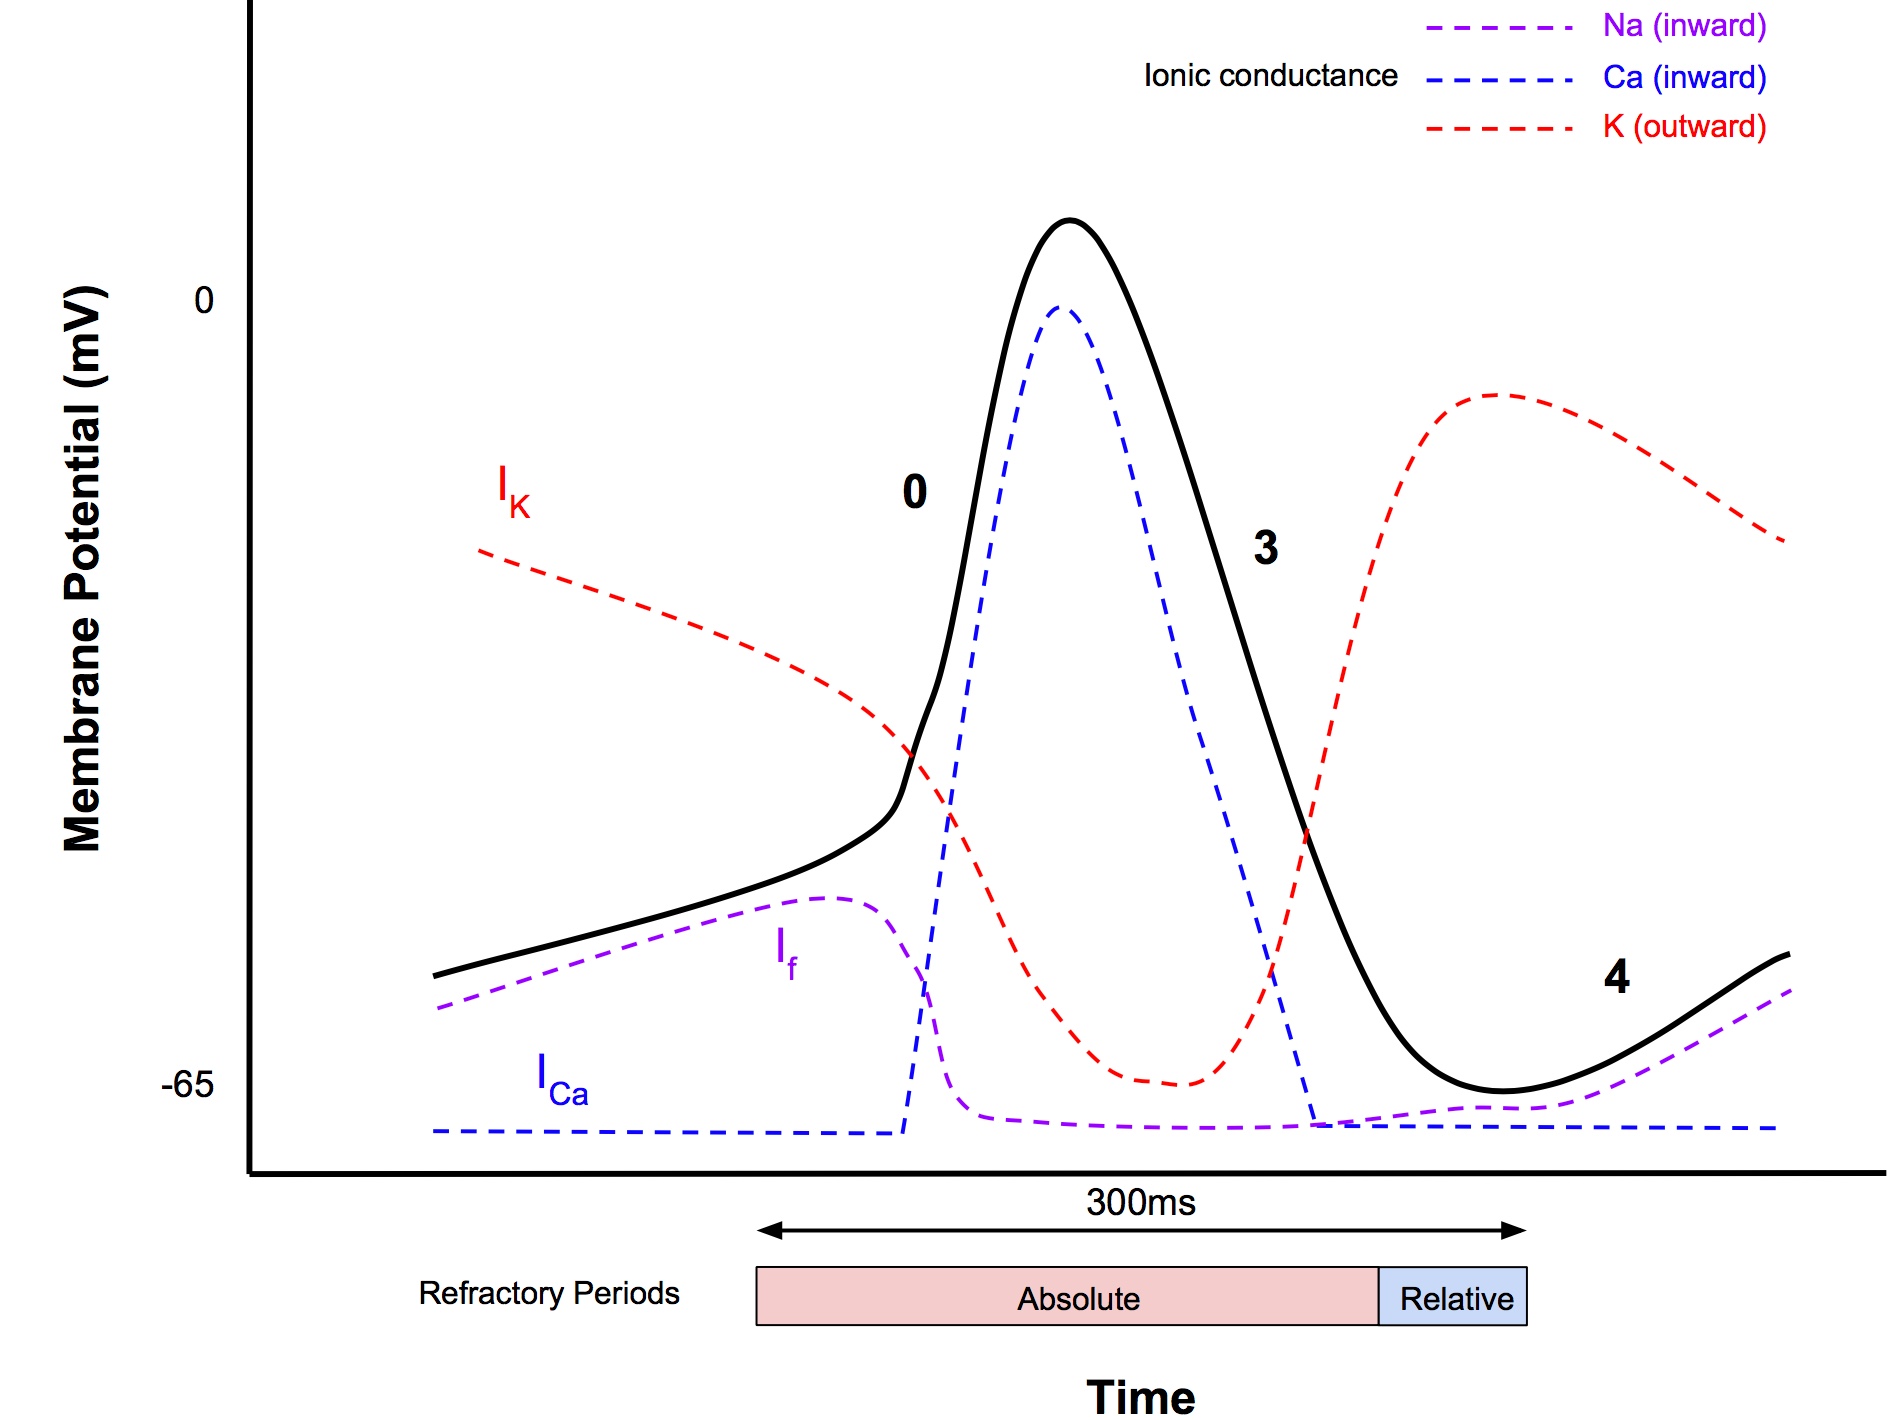
Slow Response Action Potentials
- Occur in SA and AV nodes
- AP magnitude 85mV
- AP duration 300ms
- Speed of propagation: 0.02-0.1m/s
- SA node has no resting state, instead it exhibits automaticity that generates cardiac autorhythmicity (the automatic generation of regular pacemaking activity)
- Minimum membrane potential -65mV
Phase 0
- Less steep compared to fast AP, due to influx of Ca2+ (T-type transient Ca2+ channels)
- Threshold at -40mV
- No sodium current is involved, in contrast to fast AP
Phase 1 and 2
- Absent
Phase 3
- Similar events to fast response
Phase 4 (Pacemaker potential or prepotential)
- Steady depolarisation (called pacemaker potential) until threshold is reached, that triggers phase 0
- At least 3 currents involved:
- Inward funny current (If) - yes this is the real name!
- Na+ influx (different channels to fast Vg Na+ channels)
- Called funny because the opening of the channel is trigger by hyperpolarisation of the cell membrane, rather than depolarisation
- Activated when membrane potential drops below -50mV
- Calcium current
- Activated towards end Phase 4 when MP reaches -55mV
- Accelerates depolarisation
- Outward K current
- Opposes diastolic depolarisation
AV ring:
- Insulation: only pathway between atria and ventricle. Allows delay so co-ordination of contraction
- Structural: origin and insertion of myocardium and heart valves
- AP travel from cell to cell along low resistance intercalated discs
Overdrive Suppression
- Automaticity of pacemaker cells is depressed after a period of high frequency excitation
- Due to Na:K ATPase being more active once stimulus ceased → hyperpolarise (more -ve) cell membrane
Automaticity
- ability of heart to initiate its own beat
Rhythmicity
- regularity of pacemaker activity
- SA has greater rhythmicity so suppresses other sites
Effects of Autonomic Tone
- Sympathetic
- ↑ flux of all 3 channels in phase 4 → increase slope of pacemaker potential and HR
- Parasympathetic
- Activation of K channels → hyperpolarisation (more -ve) → reduce slope of pacemaker → ↓HR
Myocardial O2 Supply / Demand
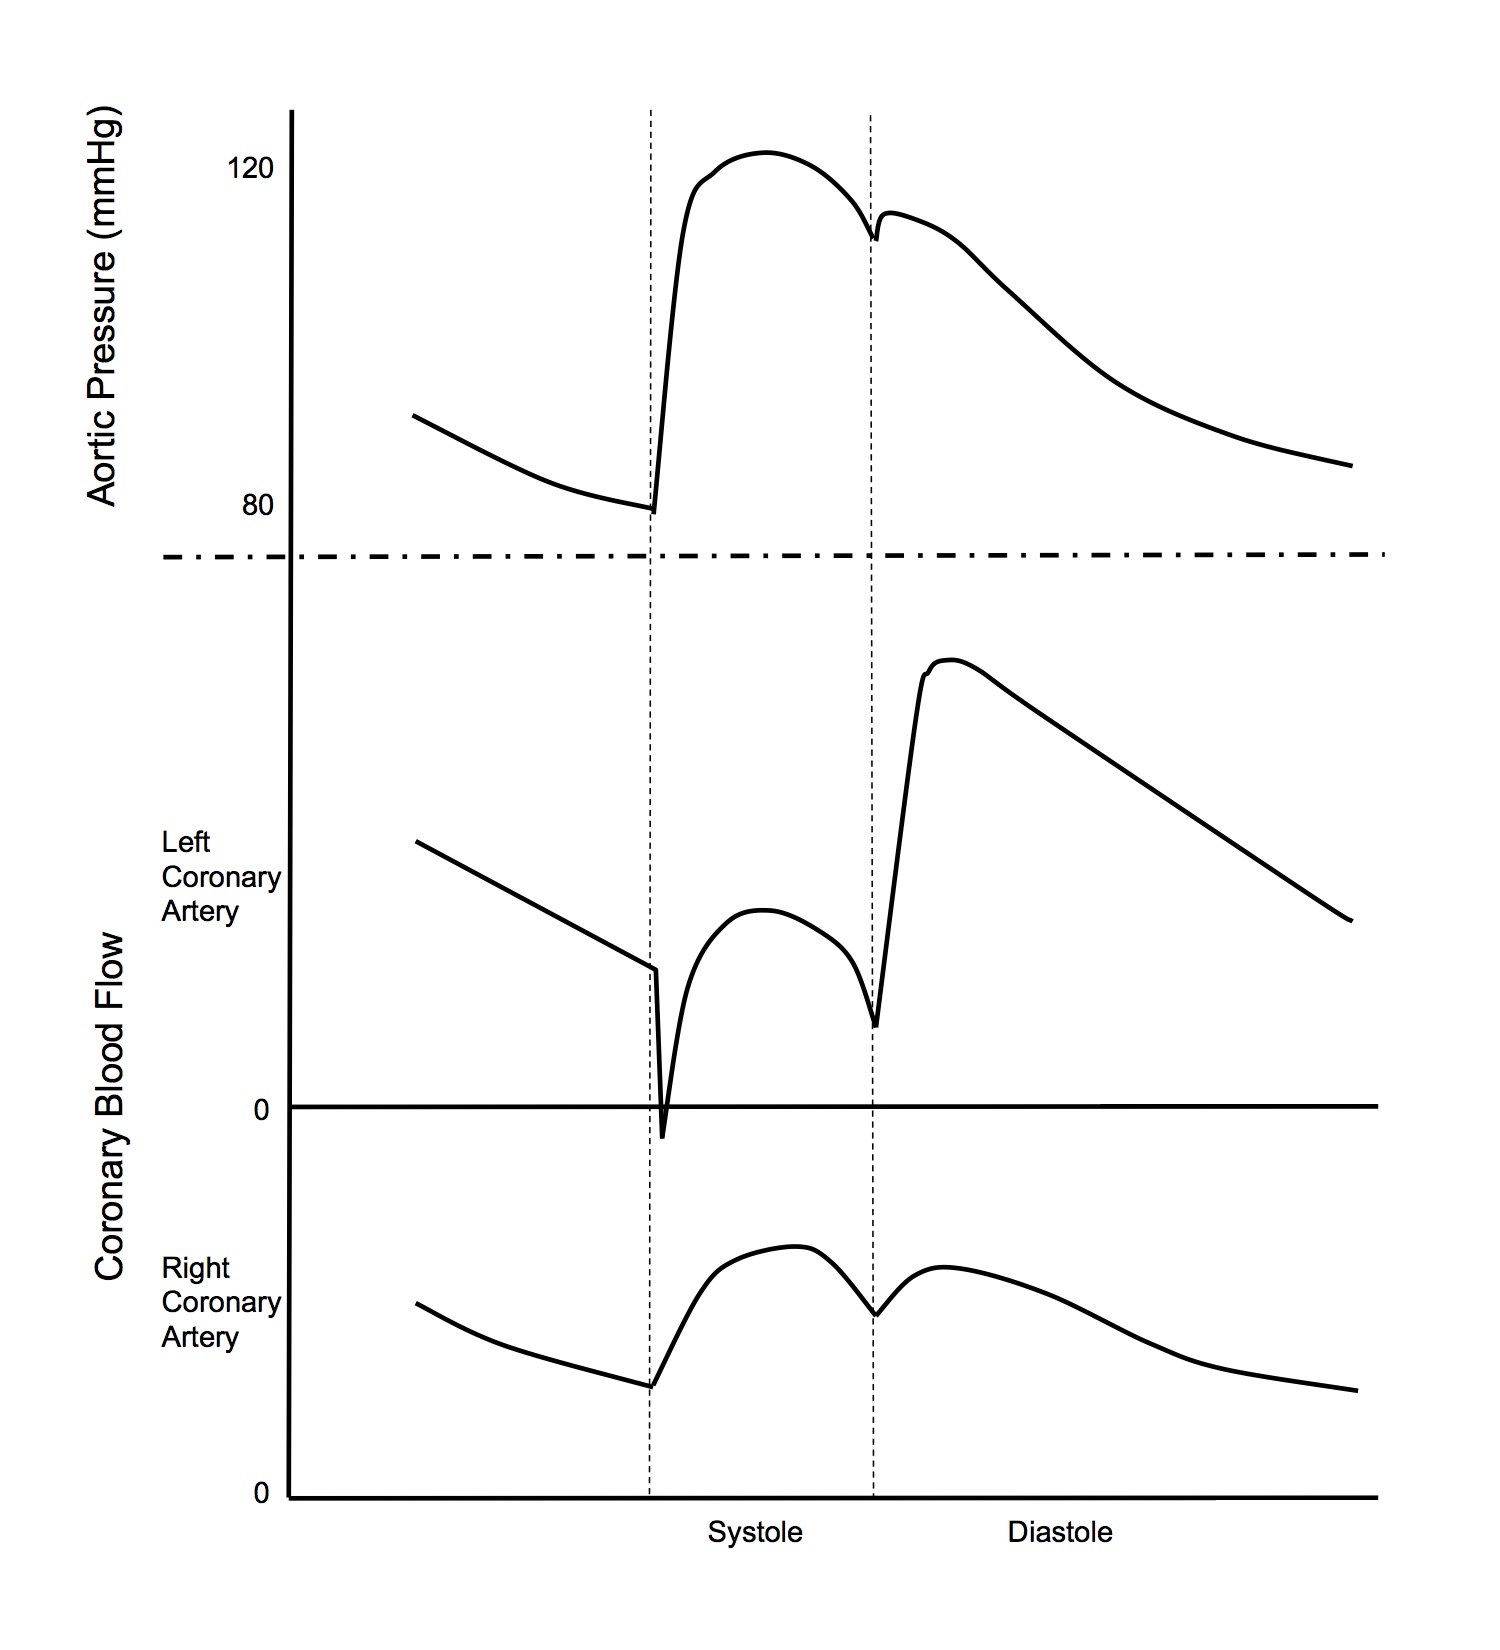
Coronary Blood Flow
 Normal Value
- 200-250ml/min
- 5% of cardiac output
- Driving pressure for perfusion = upstream pressure - (greater of downstream pressure or extrinsic pressure)
- This is another example of a Starling resistor
- CPP = aortic root P - (greater of coronary sinus P or intraventricular P)
- Coronary sinus drains into right atrium and therefore its pressures are similar to right atrial pressures
- Blood flow occurs predominantly in diastole
- This is because during systole, the intraventricular pressure is equal to the aortic root pressure
- Systole
- CPP = aortic sys P - LV sys intraventricular P = 120 - 120 = 0mmHg
- Diastole
- CPP = aortic dia P - RAP = 80 - 5 = 75mmHg
- Because perfusion occurs mainly in diastole and aortic dia P is much larger than RAP, arterial diastolic pressure can be used as an index of LV coronary perfusion pressure
- Blood flow occurs more evenly in systole and diastole, compared to the LV
- Systole
- CPP = aortic sys P - RV sys intraventricular P = 120 - 25 = 95mmHg
- Diastole
- CPP = aortic dia P - RAP = 80 - 5 = 75mmHg
Factors Affecting CBF
- Coronary blood flow can be examined using the Hagen-Poiseuille Law
- Describes laminar flow of a Newtonian fluid through a cylindrical pipe of constant cross-section
- Blood is a non-Newtonian fluid and blood flow is not always laminar, so in an exam answer, could note that Hagen-Poiseuille Law does not strictly apply, but is still a useful framework to examine factors affecting blood flow
- V=Pπ r4/nl
- V = velocity
- P = driving pressure
- r = radius
- n = viscosity
- l = length
Driving Pressure
- This is the most important factor to elaborate on in an exam question on factors determining coronary blood flow!
- See above section Coronary Blood Flow
Radius
- Metabolic autoregulation
- Coronary blood flow parallels myocardial metabolic activity
- Mechanism involve release of vasodilator substances such as adenosine and NO that vasodilates the arterioles to meet metabolic demand
- Sympathetic innervation
- Sympathetic stimulation causes coronary vasoconstriction
- However, this effect is overridden by metabolic autoregulation
Viscosity
- Blood viscosity relates, amongst other factors, to haematocrit
- Higher haematocrit→ ↑ O2 carrying capacity, but also ↑ viscosity
- Hb 100g/L is considered the optimal balance of O2 carrying capacity and viscosity
Myocardial Oxygen Supply
- Myocardial O2 supply is the product of
- Coronary blood flow
- O2 content of blood
- O2 carrying capacity
- O2 saturation of Hb
- Coronary blood flow is 200-250ml/min
- Arterial oxygen content 20.1ml/dL (from O2 flux equation)
- Myocardial O2 supply therefore is 40-50ml/min
Myocardial Oxygen Demand
- Heart is 300g
- O2 consumption is 7-9ml/100g/min = 21-27ml/min
Factors Affecting O2 Consumption Rate
- Major Determinants
- Myocardial wall tension
- Contractility
- Heart rate
- Minor Determinants
- Basal metabolic processes (constant, 25% of total myocardial O2 consumption)
- External work performed
- Work = pressure x volume
- Pressure work uses more energy than volume work
- Energy for electrical activation (0.5-1% of total myocardial O2 consumption)
Myocardial O2 Supply / Demand Balance
- Heart has a high oxygen extraction ratio, 55-65%, compared to the overall oxygen extraction ratio of the body of 25%
- Consumes 21-27ml of the 40-50ml delivered each minute
- This means that ↑ O2 demand can only be met by ↑ coronary blood flow, as there is no more room to ↑ O2 extraction
- CBF can ↑ by 4 -5 fold during exercise, to 1000-1250ml/min
- Due to metabolic autoregulation
- Overrides any sympathetically mediate vasoconstriction
- Note that tachycardia has a detrimental effect on supply/demand balance
- Increases O2 consumption (heart rate is a major determinant)
- Decreases O2 supply (reduced diastolic time)
Circulation
Starling's Forces
- The 4 forces involved in determining the net filtration pressure across the capillary membrane
- Capillary hydrostatic pressure (Pc)
- Interstitial hydrostatic pressure (Pi)
- Plasma oncotic pressure (π p)
- Interstitial fluid oncotic pressure (π i)
Normal Values
| Capillary hydrostatic pressure (Pc) | 35mmHg (arterial end) 15mmHg (venous end) |
| Interstitial hydrostatic pressure (Pi) | 0mmHg |
| Plasma oncotic pressure (π p) | 28mmHg |
| Interstitial fluid oncotic pressure (π i) | 3mmHg |
Net Filtration Pressure
- (Pc - Pi) - (π p - π i)
- 10mmHg at arterial end → filtration of fluid out of capillary into interstitium
- -10mmHg at venous end → reabsorption of fluid
- Overall balance, in body, 4L/day net filtration of fluid which is returned into circulation via the lymphatics
Special Capillary Systems
- Glomerular capillaries
- High hydrostatic pressures → filtration along whole length
- Pulmonary capillaries
- Low hydrostatic pressures → favours reabsorption of alveolar fluid
Regional Circulations
| Region | Mass (kg) | Blood flow | O2 Consumption | Percentage of Total | |||
| ml/min | ml/100g/min | ml/min | ml/100g/min | Cardiac Output | O2 Consumption | ||
| Liver | 2.6 | 1500 | 58 | 51 | 2.0 | 30 | 20 |
| Kidneys | 0.3 | 1260 | 420 | 18 | 6.0 | 23 | 7 |
| Brain | 1.4 | 750 | 54 | 46 | 3.3 | 14 | 18 |
| Skeletal muscle | 31.0 | 840 | 2.7 | 50 | 0.2 | 16 | 20 |
| Skin | 3.6 | 460 | 13 | 12 | 0.3 | 8 | 5 |
| Heart | 0.3 | 250 | 84 | 29 | 9.7 | 5 | 12 |
| Rest of body | 24 | 336 | 1.4 | 44 | 0.2 | 6 | 18 |
| Whole Body | 63 | 5400 | 8.6 | 250 | 0.4 | 100 | 100 |
Distribution of Blood Volume
| Systemic Circulation (83%) | Aorta Arteries Arterioles | 11% |
| Capillaries | 5% | |
| Venules Veins | 67% | |
| Pulmonary Circulation (12%) | Arteries | 3% |
| Capillaries | 4% | |
| Veins | 5% | |
| Heart (5%) | Heart | 5% |
The Heart Pump
Cardiac Cycle
Ventricular Systole- Isovolumetric Contraction
- Closure of atrioventricular valves marks onset
- Interval between start of ventricular systole and opening of semilunar valves
- Ejection
- Opening of semilunar valves marks onset
- 2 phases
- rapid ejection (earlier, shorter)
- sharp rise in ventricular and aortic pressures
- terminates at peak pressure
- reduced ejection (later, longer)
- runoff of blood from aorta to peripheries > ventricular output
- hence aortic pressure declines
- Isovolumetric Relaxation
- Onset marked by closure of the semilunar valves
- Interval between closure of semilunar valves and opening of the atrioventricular valves
- Rapid Filling
- Rapid flow of blood from atria to relaxing ventricles
- ↓ atrial and ventricular pressures
- Diastasis
- Slow ventricular filling
- From blood returning
- peripheries → right ventricle
- lungs → left ventricle
- Slow ↑ atrial and ventricular pressures
- Atrial Systole
- Peristalsis like wave of contraction
- Small ↑ atrial, ventricular and venous pressures
- Contribution to cardiac output greater when
- fast heart rate
- mitral stenosis
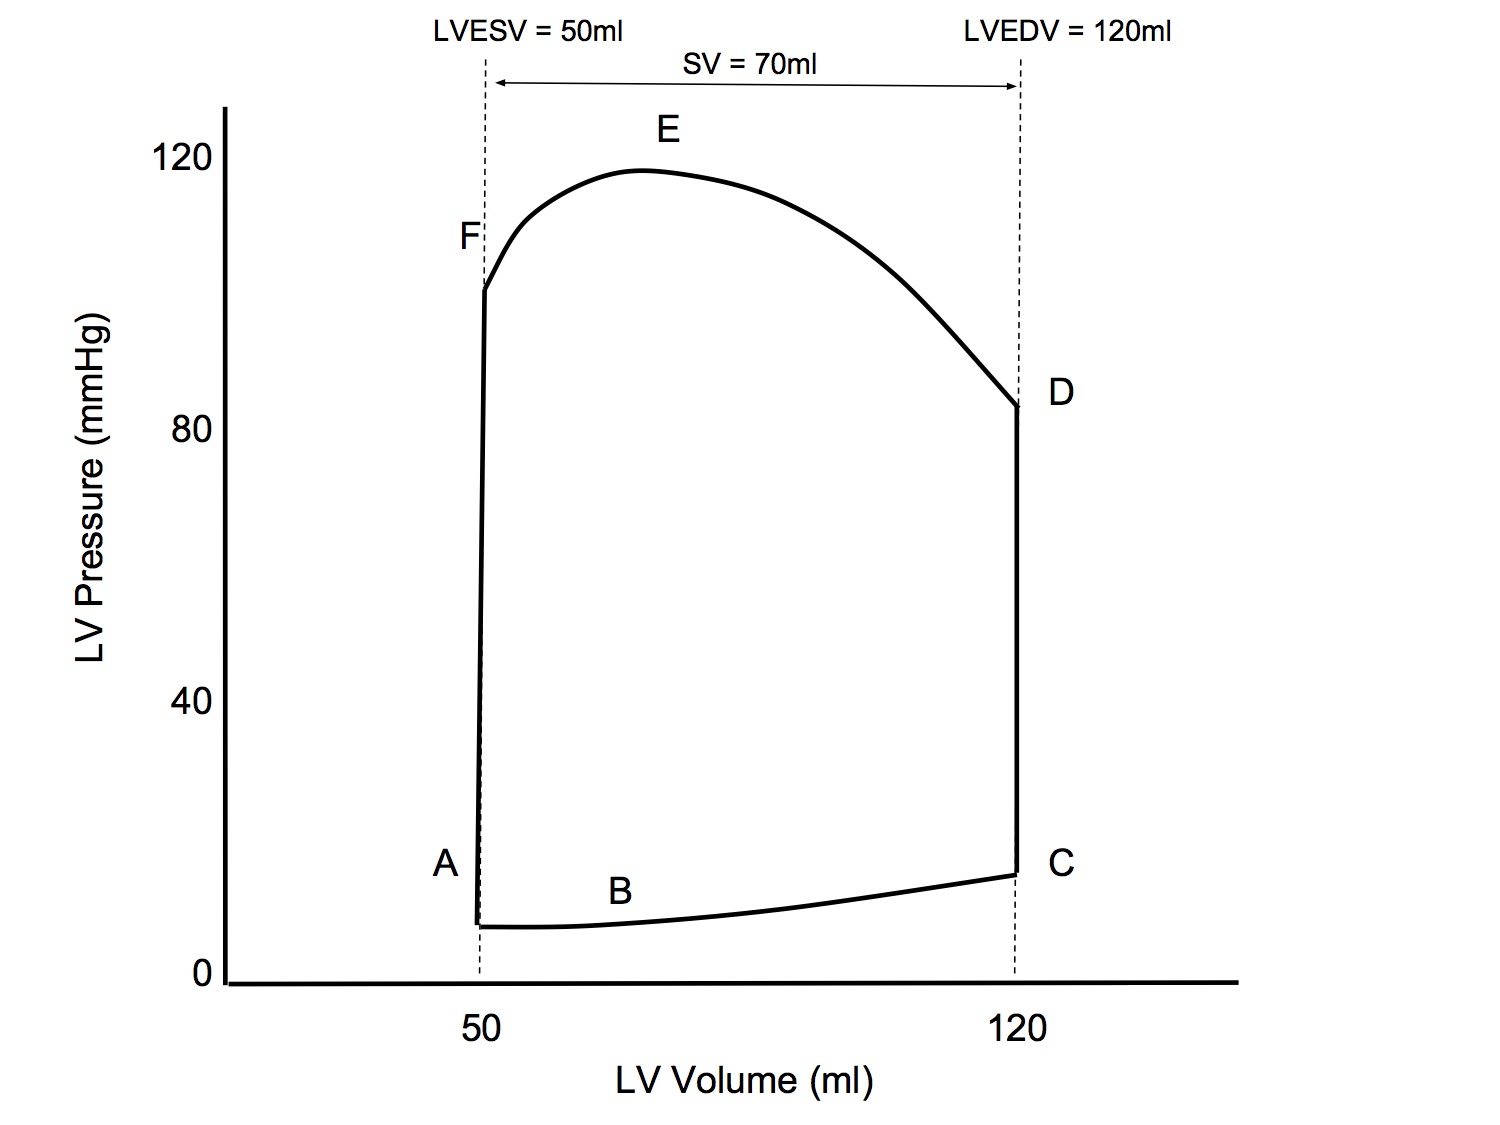
Pressure-Volume Loop
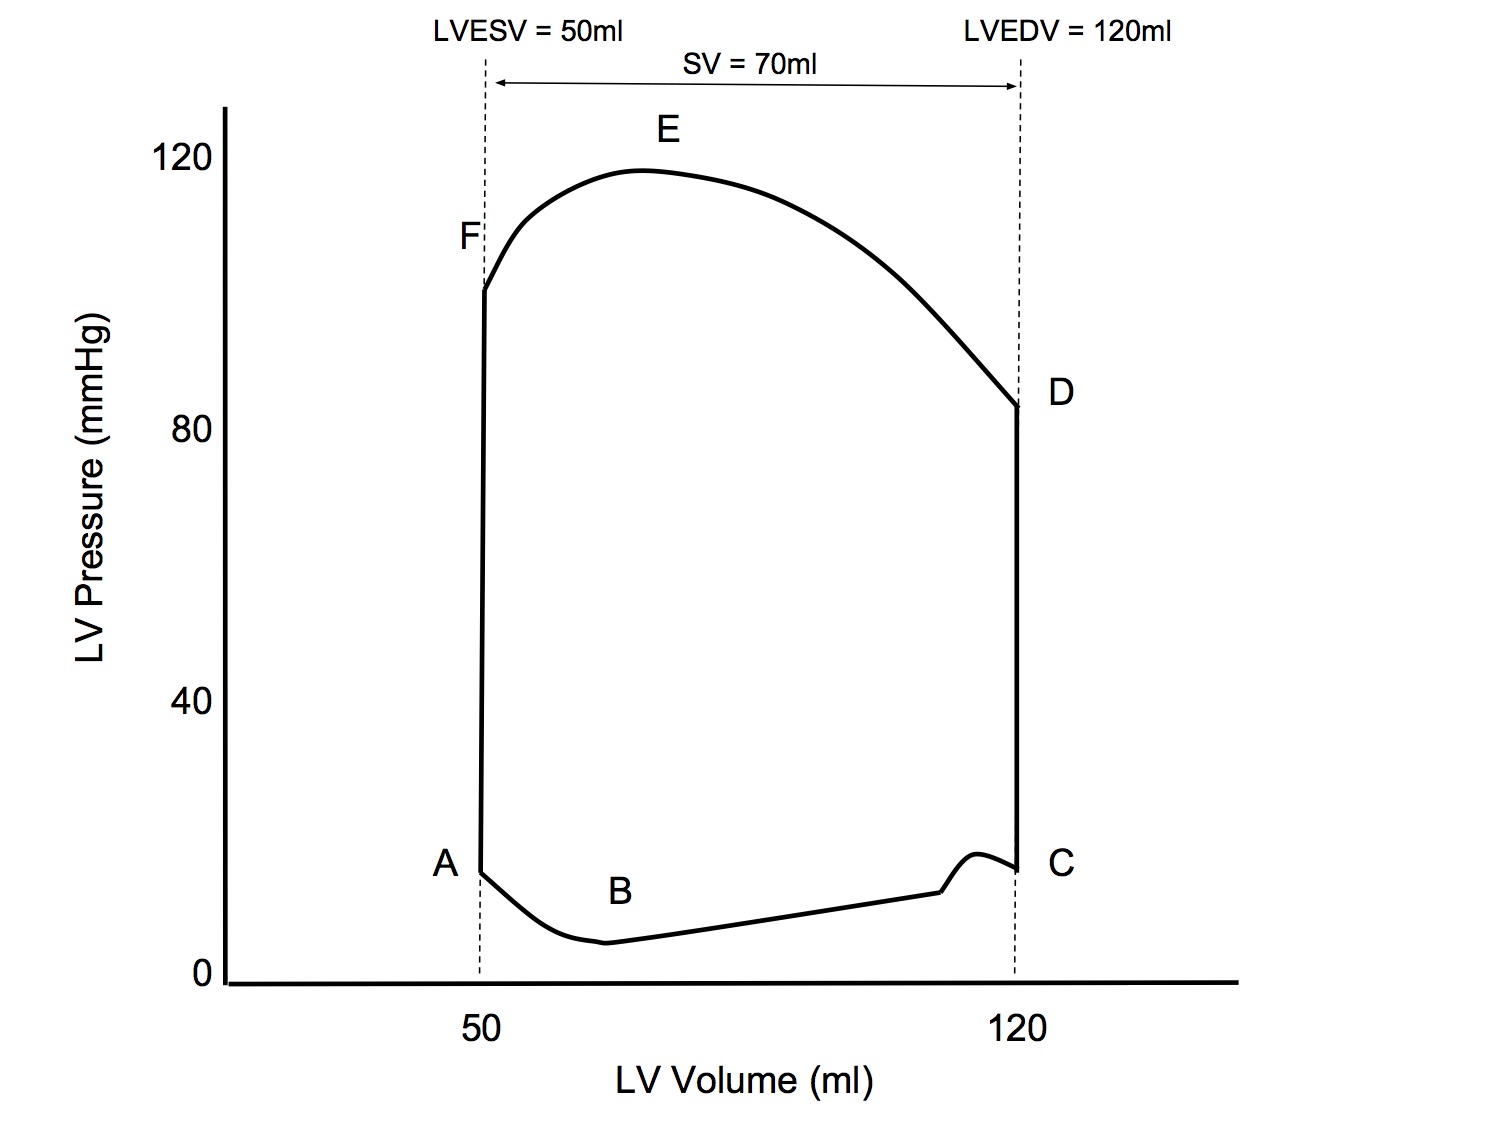
| Point / Interval | Event |
|---|---|
| A | Mitral valve opens |
| A - B | Rapid filling |
| B - C | Diastasis with atrial kick |
| C | Mitral valve closes |
| C - D | Isovolumetric contraction |
| D | Aortic valve opens |
| D - E | Rapid ejection |
| E - F | Reduced ejection |
| F | Aortic valve closes |
| F - A | Isovolumetric relaxation |
Simplified Pressure-Volume Loop
- A lot of references seem to simplify the loop by ignoring the rapid filling phase and the atrial kick
- For exam purposes, I would recommend using the simplified version
- This will make it simpler to illustrate the effects of changing preload, afterload and contractility
P-V Loop: Altered Preload
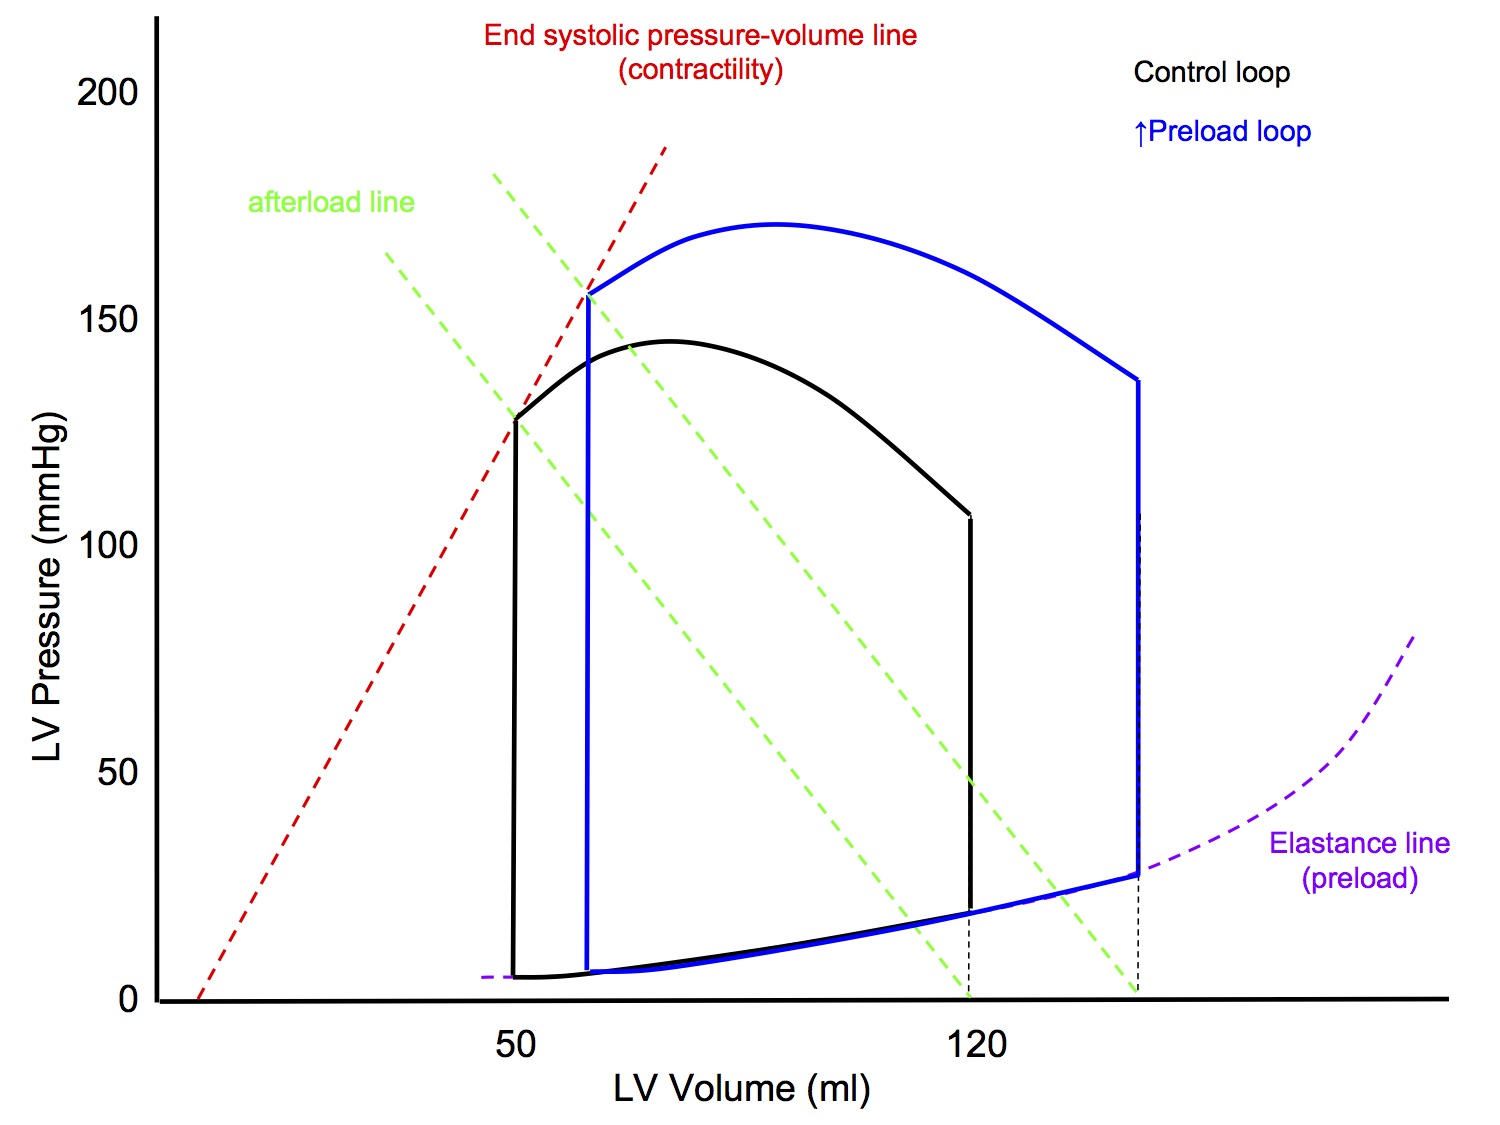
↑ Preload
- LVEDV will be increased (following the LV elastance line)
- Slope of afterload line unchanged
- Slope of end systolic pressure-volume line (contractility) unchanged
- End result
- ↑ LVEDV
- ↑ Peak pressure
- ↑ Stroke volume
P-V Loop: Altered Contractility
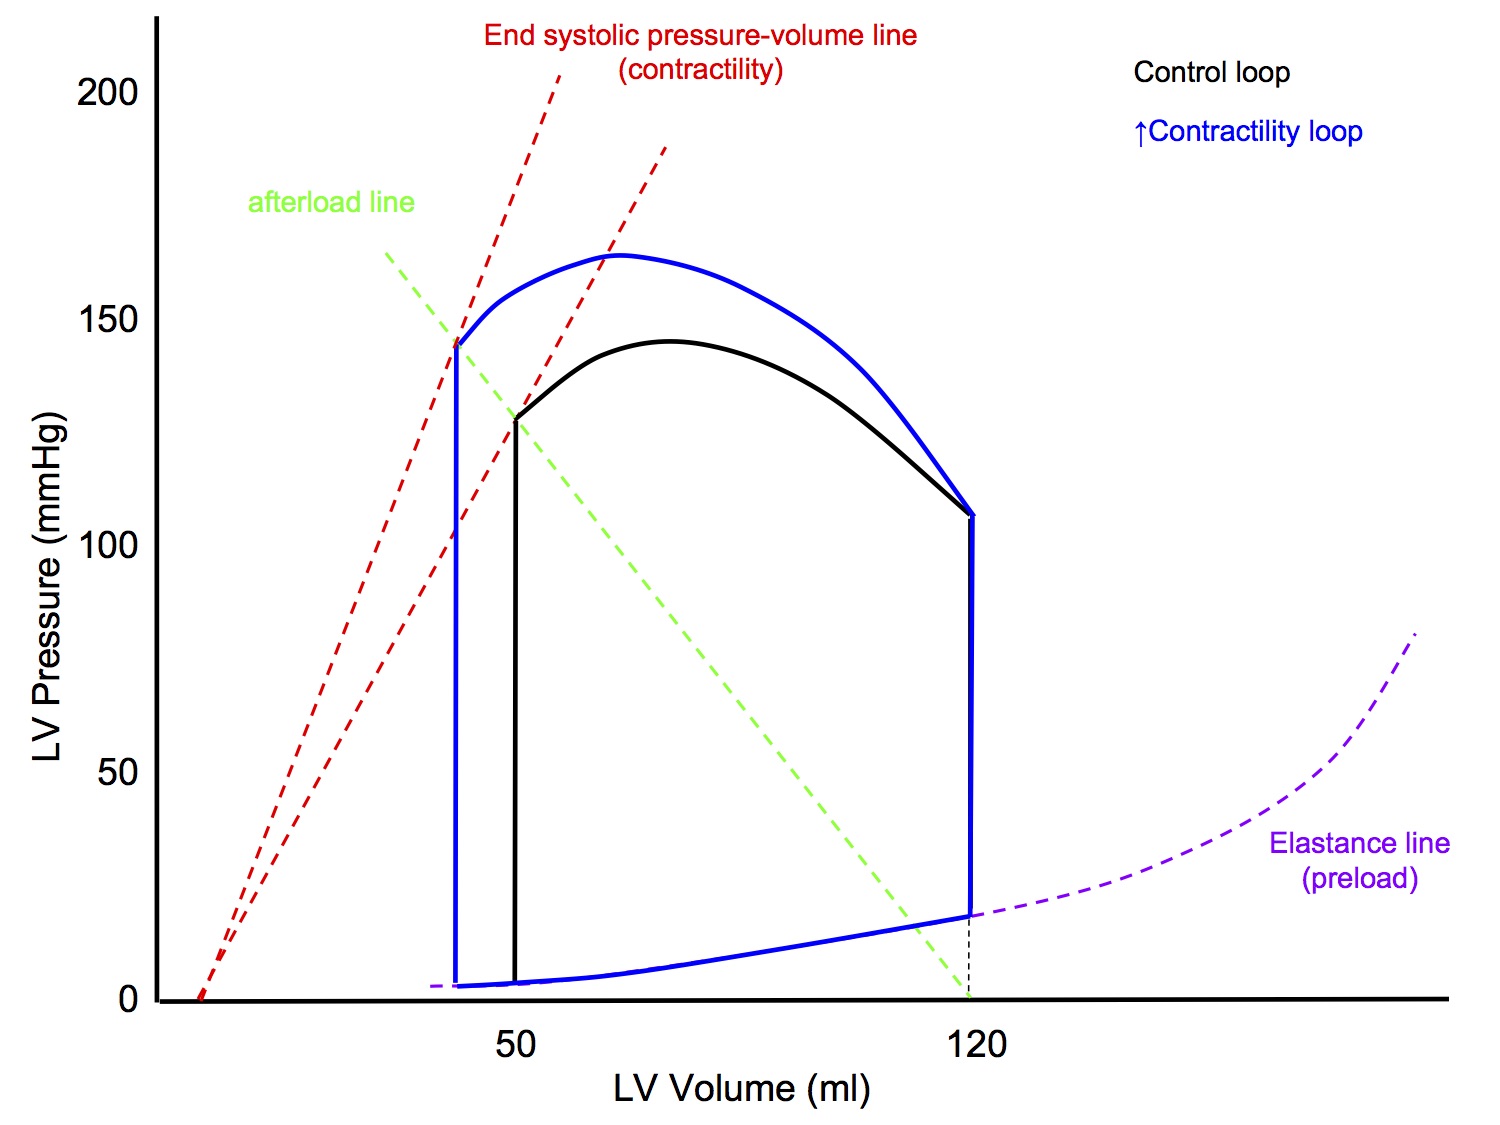
↑ Contractility
- LVEDV unchanged
- Slope of afterload line unchanged
- ↑ Slope of end systolic pressure-volume line (contractility)
- the slope of the original end systolic pressure-volume line is worked out experimentally
- End result
- LVEDV unchanged
- ↑ Peak pressure
- ↑ Stroke volume
P-V Loop: Altered Afterload
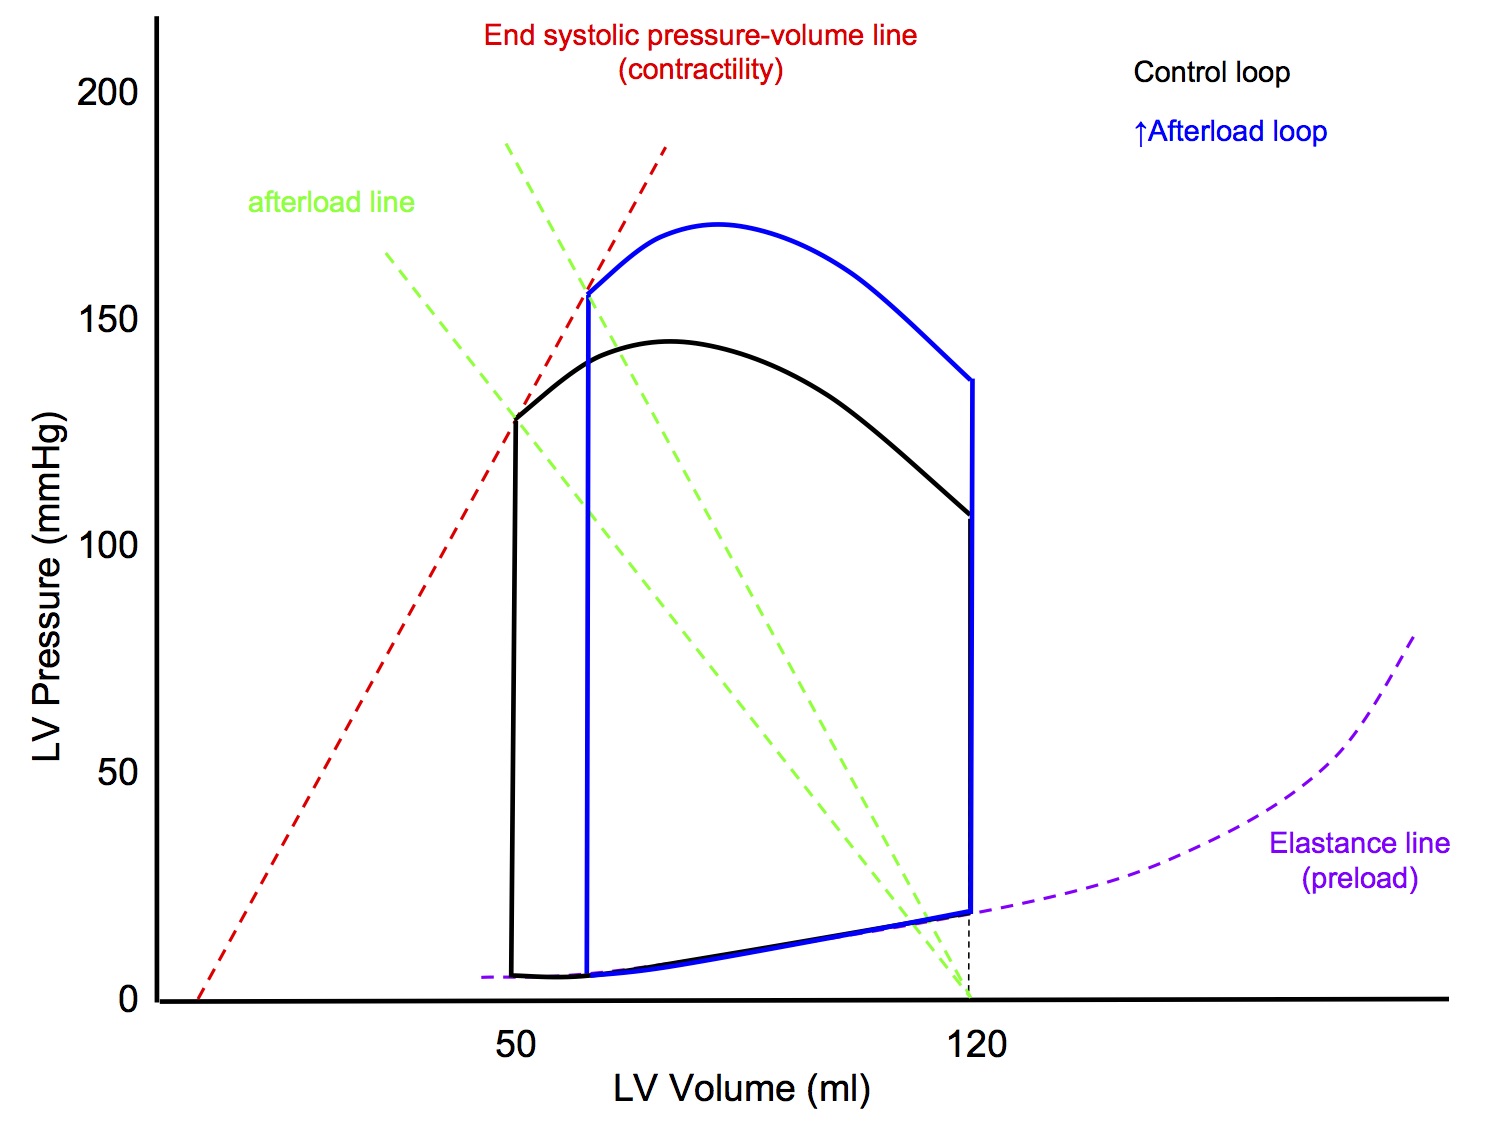
↑ Afterload
- LVEDV unchanged
- Slope of afterload line increased
- line joining point on x axis at LVEDV to end systolic point
- Slope of end systolic pressure-volume line (contractility) unchanged
- End result
- LVEDV unchanged
- ↑ Peak pressure
- ↓ Stroke volume
Cardiac Output
Normal Cardiac Output
Definition
- The volume of blood pumped by the heart pumped by the heart into the systemic circulation per unit time
Normal value
- 5L/min
- Can ↑ x 5-6 fold to 25-30L/min in healthy young adult
- Elite athlete may have max CO of up to 40L/min
- Must equal venous return over a period of time
Cardiac Output Equation
- CO = HR x SV
- CO - cardiac output
- HR - heart rate
- SV - stroke volume
- Under normal circumstances, heart rate may increase by up to 300% (eg 60 to 180bpm), while stroke volume can increase only by roughly 50% (eg 70 to 105ml) , so heart rate is numerically a more important determinant of CO than SV
- This distinction is accentuated in the neonate, where myocardial compliance is lower and hence SV cannot be increased by much. Bradycardia in neonate = ↓ CO
Control of Cardiac Output
- Control of cardiac output is - for me at least - both very simple, yet at the same time, a frustratingly convoluted concept that makes my brain hurt when I try to get my head around it!
The Superficial Analysis
- CO = HR x SV
- Hence you can analyse control of CO by examining the factors that affect heart rate and stroke volume
Heart Rate
- Heart rate is set by the SA node pacemaker activity
- This is modulated by the autonomic nervous system
- Denervated heart has basal HR of 100-120bpm
- At rest, tonic parasympathetic activity (vagus) reduces the basal HR to 60-70bpm
- With exercise, there is ↑ HR resulting from
- ↓ parasympathetic tone
- ↑ sympathetic tone (cardioaccelerator fibres T1-4)
- adrenaline release from adrenal medulla
Stroke Volume
- Stroke volume is determined by 3 factors
- Preload
- Contractility
- Afterload
- See sections below for further discusssion
The Integrated Analysis
- The above analysis, that CO = HR x SV, is mathematically correct and a good way to introduce the topic of control of CO for exam purposes, I think
- However, it is not the full story and if you leave it at that, I think you would scrape in a pass but wouldn't score much better than that
- This is because we have analysed each factor as if it were independent of all the others, we are basically saying:
- If you ↑ HR → ↑ CO
- If you ↑ preload → ↑ CO
- If you ↑ contractility → ↑ CO
- If you ↑ afterload → ↓ CO
- This may happen in a lab, under controlled conditions, but in vivo
- Between HR 40-180, isolated change in HR does not change CO (see Brandis Chapter 3 Cardiac Output)
- Similarly, an isolated change in preload, contractility or afterload tends to cause changes in the other factors that counteracts the change in CO
- eg Anrep Effect: ↑ afterload → ↑ contractility
- It's not as simple as CO = HR x SV!
- The way I see it, there are 3 underlying principles at work simultaneously:
- The heart is a demand pump that alters CO to meet the metabolic demands of the tissues
- Mainly due to metabolic autoregulation by the tissues and changes in tissue vascular resistance
- This mechanism allows the heart to change CO to meet demand
- The heart has mechanisms designed to let it pump as much blood as is presented to it
- Frank-Starling mechanism
- Bowditch/Treppe effect
- Anrep effect
- Bainbridge reflex
- These mechanisms are aimed at beat to beat regulation of CO and ensuring that the output of the left and right sides of the heart remain equal, preventing pump failure
- There are homeostatic reflexes that aim to keep CO constant, despite changes in one of the factors (as long as tissue demand has remained the same)
- High pressure baroreceptor reflex
- Low pressure baroreceptor reflex
- RAAS system
- Trying to get a clear picture in my mind of how all these mechanisms integrate together is when my head starts hurting!
- Please take all the above with a grain of salt - I have not seen control of CO presented like this in any textbook - I don't know if it is accurate or not, it is my own rationalization
- What I am saying is, you need to read over the topic of control of CO a few times, using different sources, until you have an understanding in your head that you can accept and explain to some extent in the exam
- This is not a topic that you should put in the too hard basket and rote learn a superficial answer. Otherwise you will not be able to answer common questions like explaining the equilibrium point between the cardiac function curve and the vascular function curve
Preload
- Preload is the initial degree of stretch on the cardiac myocytes just prior to contraction
- Alternatively, it is the load on the myocardium just prior to onset of contraction
- An index of preload can be taken from
- Sarcomere length just prior to contraction
- Left ventricular end diastolic volume
- Left ventricular end diastolic pressure (assumes normal LV compliance)
- ↑ Preload → ↑ stroke volume (up to a point)
- The relationship between preload and stroke volume is described by Starling's Law of the Heart
Starling's Law / Frank-Starling Mechanism
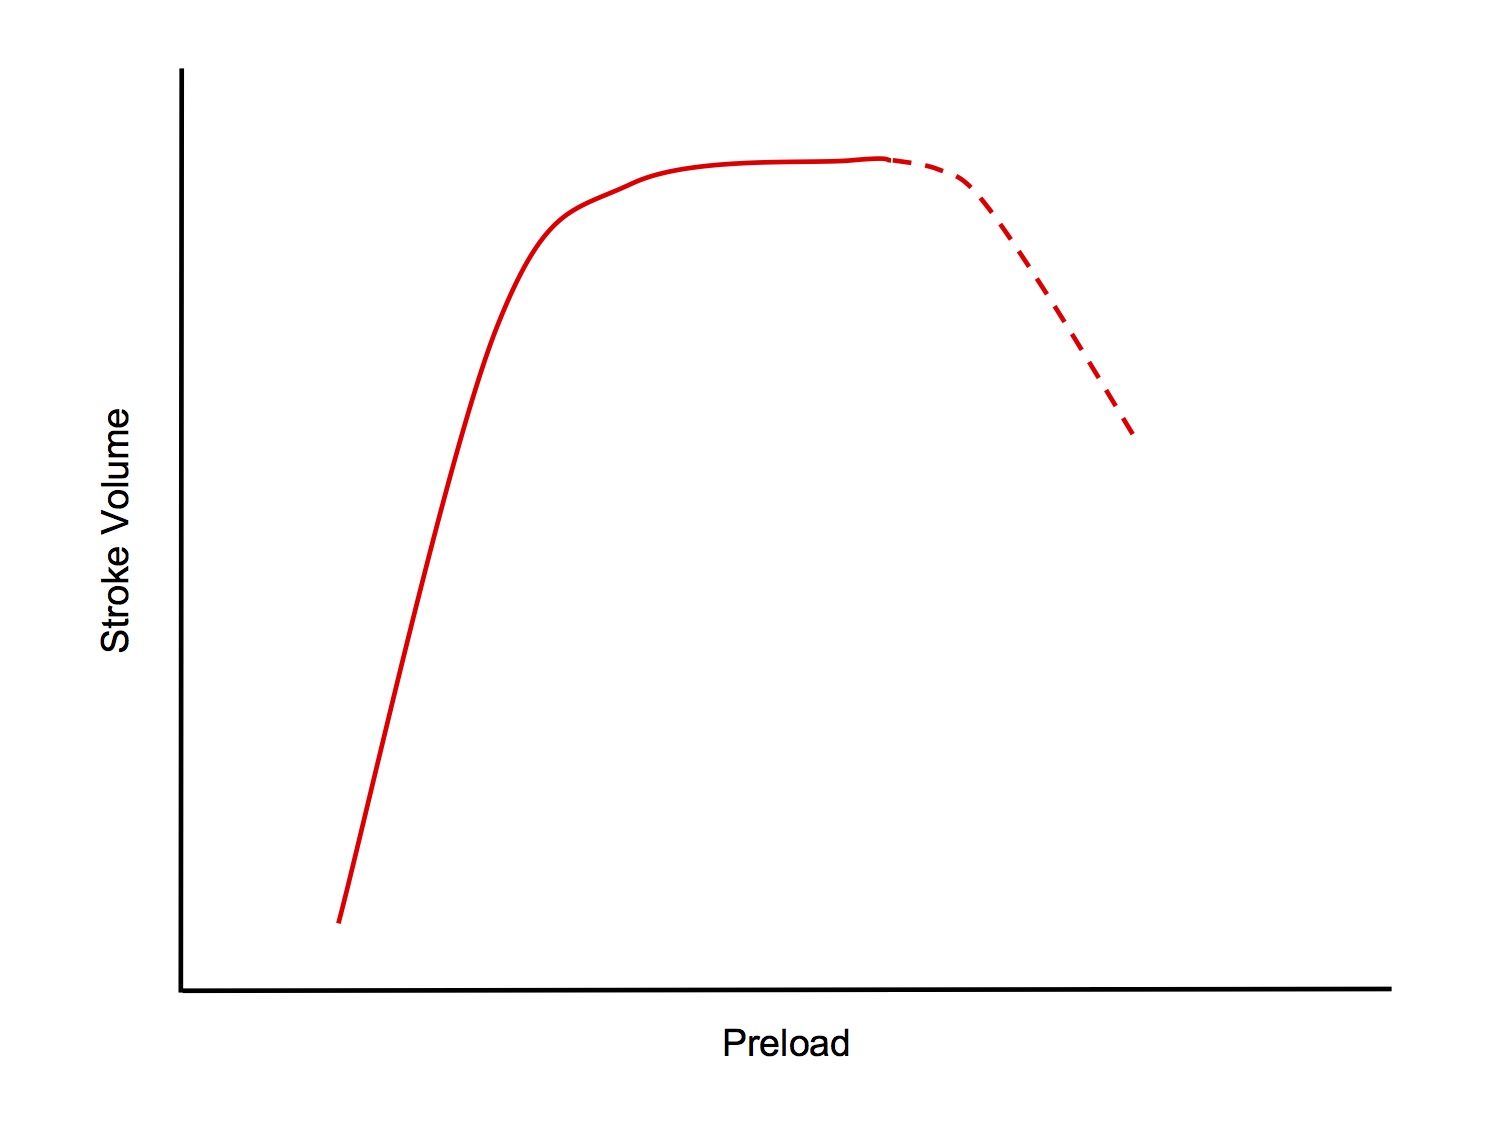
- Starling's Law states that the strength of ventricular contraction is dependent on the length of the resting fibres, ie ↑ preload → ↑ stroke volume (up to a point)
- The normal heart has an operating range of sarcomere lengths of 1.8 - 2.2um
- From 1.8 → 2.2um, strength of contraction increases
- > 2.2um, strength of contraction starts to decrease (this situation occurs only in the failing heart)
Mechanisms
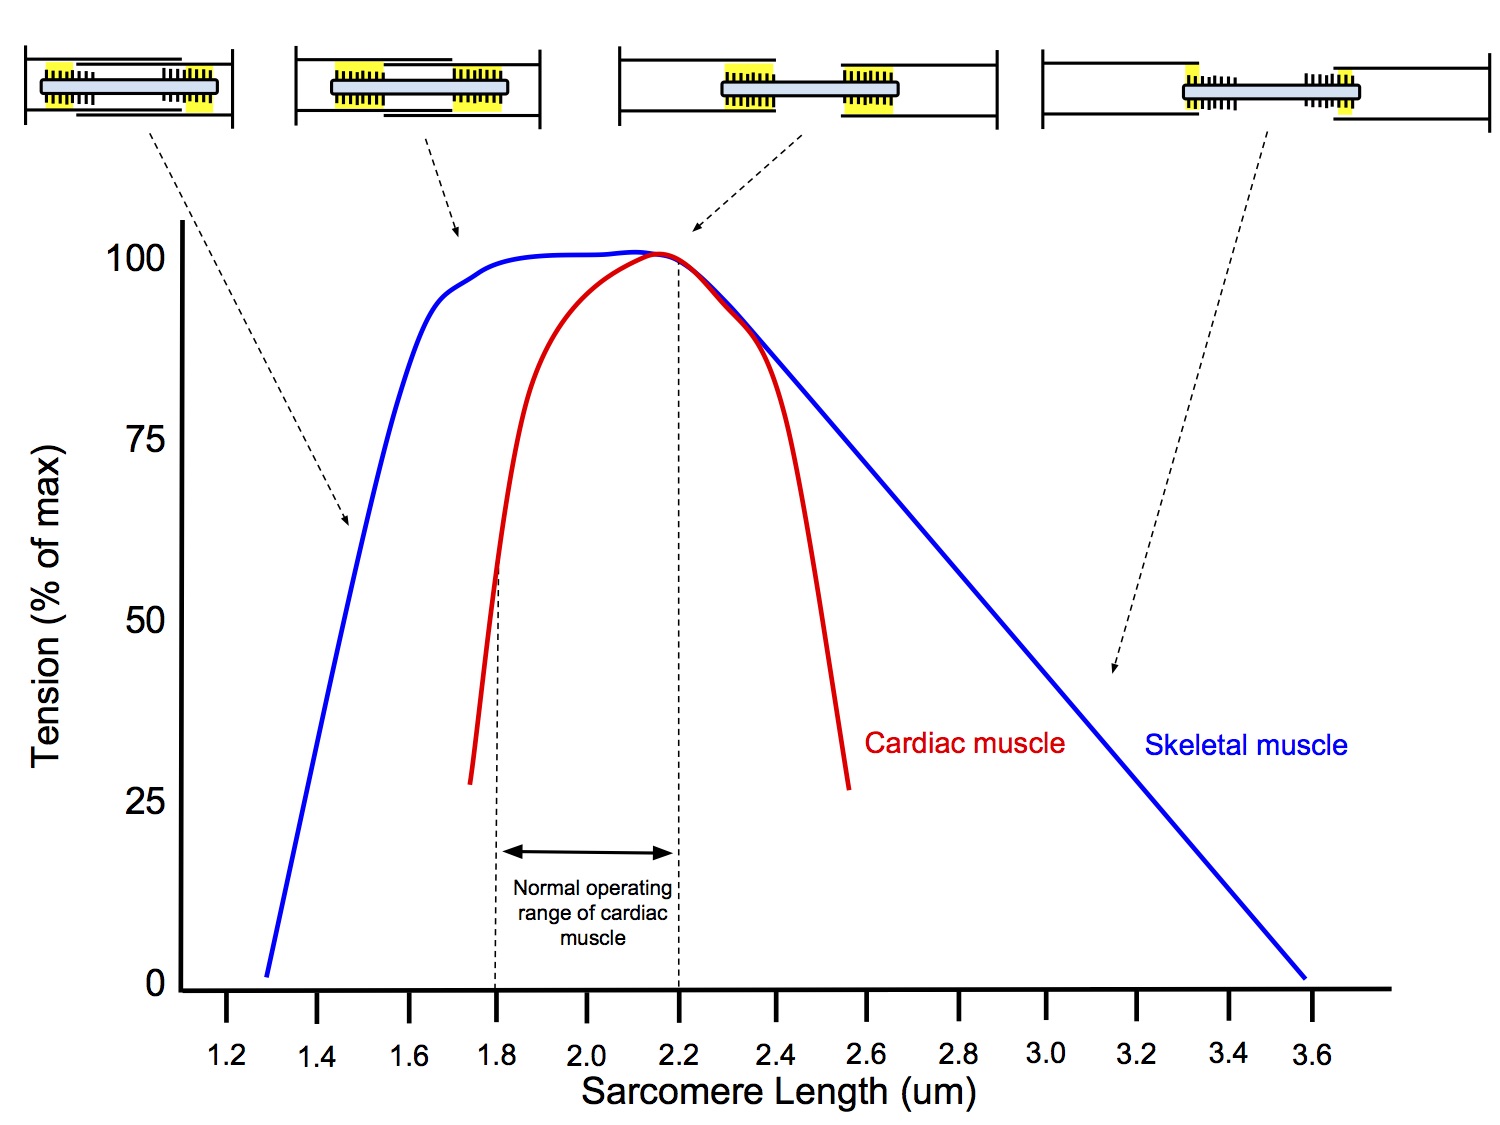
- Length-Dependent Mechanism
- The initial length of the sarcomeres determines the extent that actin-myosin cross-bridges can form and cycle (thus generating force +/- shortening)
- When sarcomere < 2.2um, the thin filaments (actin) overlap, impeding the formation of cross-bridges between thin and thick filaments (myosin), thus reducing the tension generated
- At sarcomere length 2.2um, there is no overlap of thin filaments and optimal overlap between thin and thick filaments, allowing maximal formation of cross-bridges and generation of maximam tension
- When sarcomere > 2.2um, there is less overlap between thin and thick filaments allowing less cross-bridge formation and resulting in a lower tension generated (this situation only occurs in the failing heart)
- The effect of increased sarcomere length on the contractile proteins is termed length-dependent activation
- This mechanism is also occurs in skeletal muscle
- Length-Independent Mechanism
- As sarcomere length increases from 1.8 to 2.2um, the increase in force of contraction is greater in cardiac muscle than in skeletal muscle and for any given sarcomere length, the force of contraction is greater for cardiac muscle than for skeletal muscle
- ie the increase in contractile strength with increased preload cannot be solely explained by length-dependent activation, there must be a second mechanism in play that is not present in skeletal muscle
- ↑ Stretch of cardiac myocytes → ↑ affinity of troponin C for Ca2+ → greater binding→ ↑ exposure of myosin head binding sites on actin → ↑ cross-bridge formation → ↑ strength of contraction
- I find it a bit confusing that they call this a "length-independent mechanism" when clearly the change in affinity depends on change in length of the sarcomere. I know they must have been trying to contrast it with length-dependent activation, but surely they could've chosen less ambiguous terminology...
Contractility
- Contractility is the intrinsic ability of cardiac myocytes to generate mechanical power at a given preload and afterload
- Alternatively, it is the factor responsible for changes in myocardial performance which are not due to changes in heart rate, preload or afterload
- Contractility defines the amount of work that the heart can perform, at a given load
- An index of contractility can be taken from
- (dp/dt)max, the maximum rate of pressure change in the left ventricle during isovolumetric contraction
Factors Affecting Contractility
- Sympathetic nervous system
- NA released by cardiac sympathetic neurons (and circulating NA and Adr) → ↑ contractility via β 1 adrenoceptors
- Heart rate
- ↑ HR → ↑ contractility
- This is the Bowditch effector Treppe effect
- Mechanism:
- ↑ HR → ↓ duration of each cardiac cycle, ↓ dia time > sys time
- ↑ HR → ↑ Ca2+ influx through L-type Ca2+ channels during systole
- Diastolic efflux of Na+ due to Na+/K+ pump cannot keep up with systolic influx of Na+, due to shortened diastolic time
- Na+/Ca2+ exchanger normally keeps intracellular [Ca2+] low, but with tachycardia, ↑ cytosolic [Na+]and [Ca2+] → accumulation of intracellular Ca2+ → positive inotropic effect
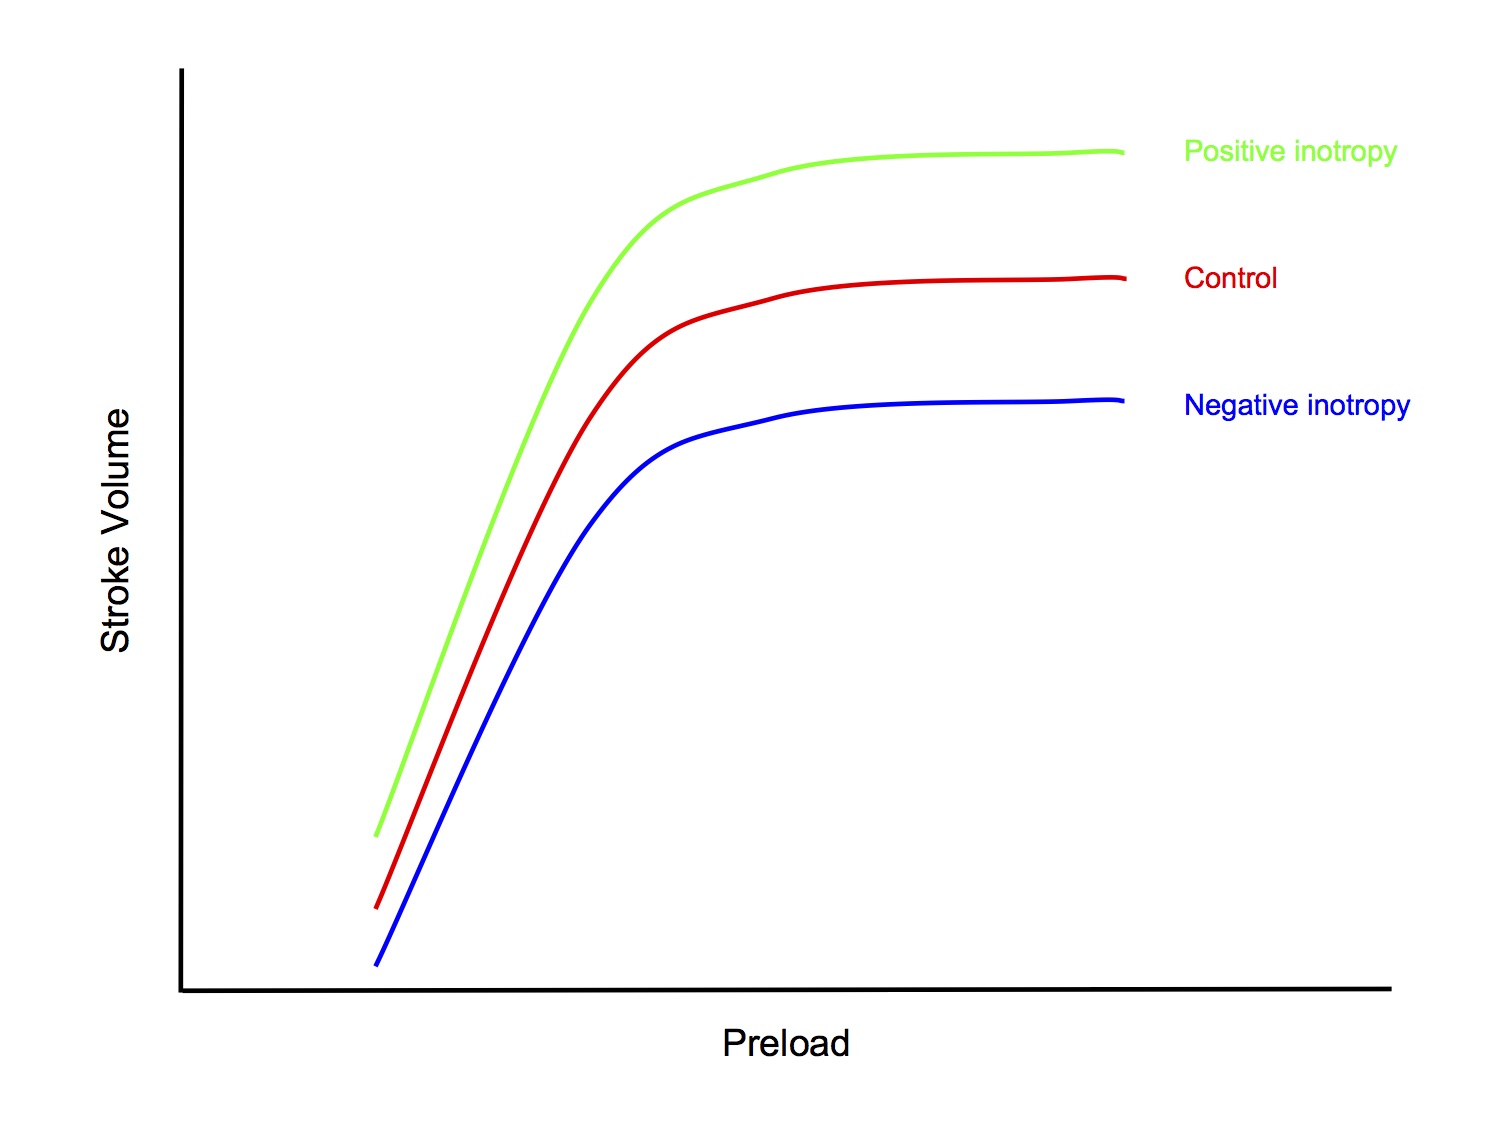
- Drugs with inotropic effect
- Positive inotropy
- dobutamine
- isoprenaline
- digoxin
- glucagon
- Negative inotropy
- β blockers
- Ca2+ channel blockers
- Disease states
- Ischaemic heart disease
- Myocarditis
- Sepsis
- Electrolyte/acid-base disturbances
Afterload
- Afterload is the impedence that the heart must overcome to eject blood into the arterial circulation
- Alternatively, it is the wall tension generated by the left ventricular wall during ejection
- An index of afterload can be taken from
- Mean arterial pressure
- Left ventricular end-systolic pressure
- Systemic vascular resistance
- Afterload is mainly determined by systemic vascular resistance
- A sudden ↑ afterload → ↓ stroke volume → ↑ LVEDV → ↑ preload → ↑ SV via Frank-Starling mechanism
- The overall result is a transient ↓ SV followed by a gradual return to baseline SV
Anrep Effect
- ↑ afterload → ↑ LV wall tension → ↑ contractility
- This means that an increase in afterload results in a smaller reduction in SV than would otherwise be predicted
Homeostatic Mechanisms
Valsalva Manoeuvre
The Valsalva Manoeuvre is a manoeuvre that increases intrathoracic pressure, commonly by forced expiration against a closed glottis
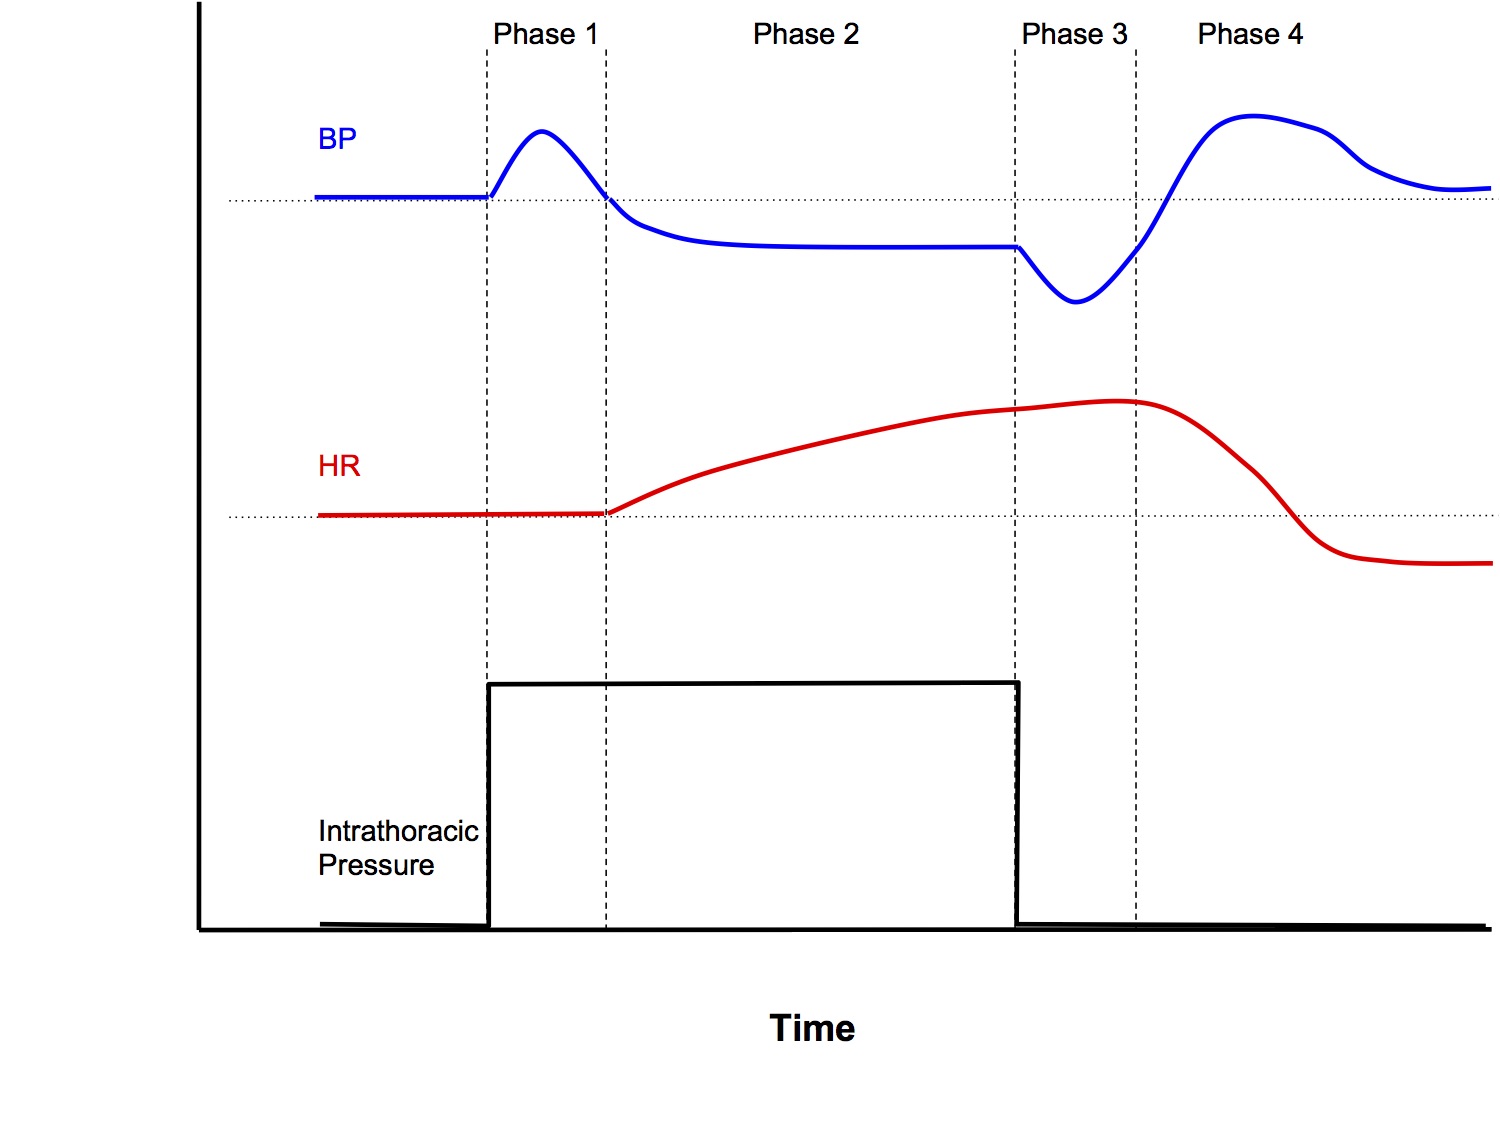
Phase 1
- With onset of straining, ↑intrathoracic pressure (ITP) → transient ↑MAP via 2 mechanisms:
- Squeeze on intrapulmonary vessels → ↑ blood returning to left heart → ↑ stroke volume via Starling’s law
- ↑ITP is transmitted onto the aorta
Phase 2
- ↑ITP → back pressure on IVC → ↓venous return (VR) → ↓ preload to heart → ↓MAP due to Starling’s law
- ↓MAP sensed by high pressure baroreceptors in carotid sinus and aortic arch → reflex tachycardia and peripheral vasoconstriction
- MAP prevented from dropping further
Phase 3
- Offset of straining causes reverse effects to Phase 1
- Transient ↓MAP due to
- Removal of squeeze on intrapulmonary vessels → ↓ blood return to left heart
- Removal of transmitted pressure to aorta
Phase 4
- ↑VR → ↑preload → larger stroke volume pumped into a vasoconstricted systemic vasculature → transient overshoot of MAP above baseline until homeostatic mechanisms return MAP to baseline
NB Heart rate changes are secondary changes in response to the baroreceptor reflex
Response to 1L Blood Loss
- 1L blood loss is a loss of ~20% circulating blood volume (class II shock)
- This triggers homeostatic mechanisms aimed at
- Maintaining vital organ perfusion pressures and cardiac output
- Peripheral vasoconstriction
- Tachycardia
- ↑ Cardiac contractility
- Redistribution of cardiac output
- Perfusion to brain and heart maintained at the expense of ↓ perfusion to kidneys, skeletal muscle, etc
- Restoring effective circulating blood volume
- Venoconstriction
- Shift of ISF to plasma
- ↓ Renal blood flow, ↓ urine output
- Mobilisation of blood reservoirs
- “ Restlessness” - ↑ muscle pump activity of leg
- Several integrated neurohormonal pathways play a role:
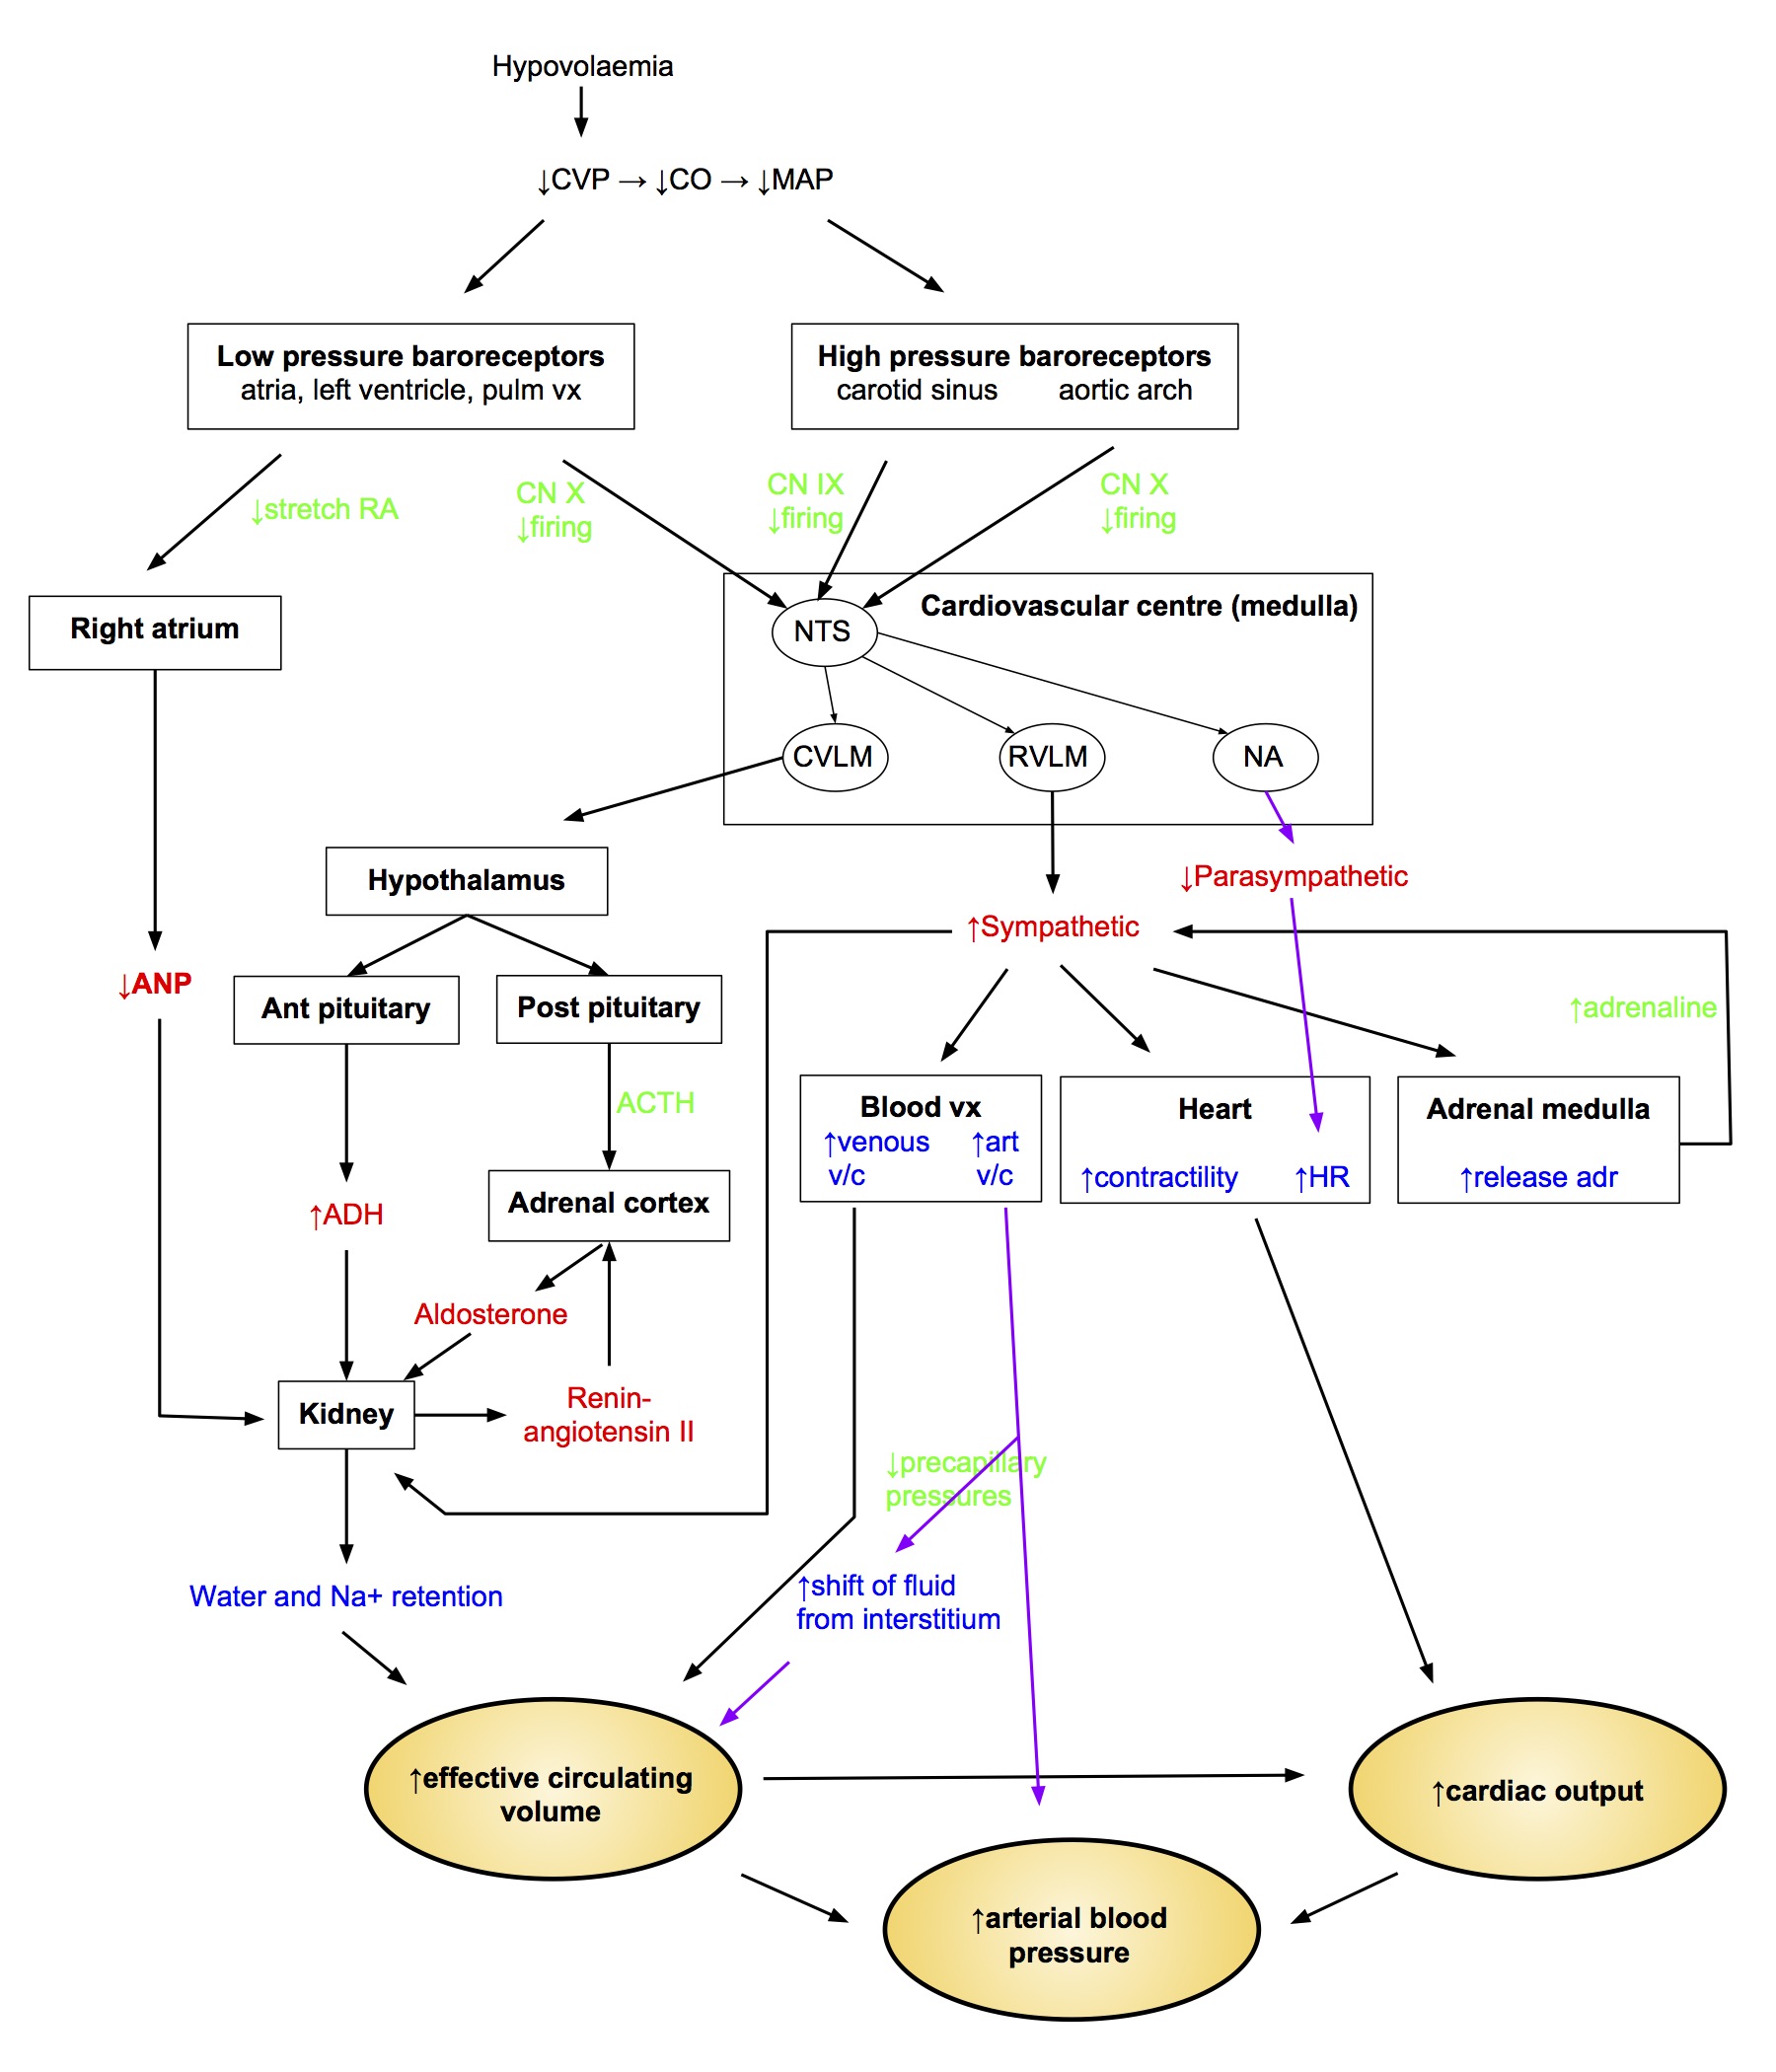
Renin-Angiotensin System
- Renin secreted by JG cells in response to
- ↑ sympathetic (β 1)
- ↑ circulating catecholamines
- ↓ aff arteriole P
- ↓ flow past macula densa
- Renin converts angiotensinogen to angiotensin I, which is then converted by ACE (mainly in lung capillaries) to active form Ang II
- Ang II actions
- adrenal cx → ↑ aldosterone secretion
- ↑ sympathetic by facilitation of NA release
- contraction of mesangial cells → ↓ filtration coeff → ↓ GFR
- ↑ Secretion of ADH and ACTH
Aldosterone
- Steroid hormone produced by zona glomerulosa of adrenal cortex
- Release stimulated by
- Ang II
- ↑ plasma [K+]
- ACTH
- Stimulates Na reabsorption and K secretion by principal cells of the cortical collecting ducts
Antidiuretic Hormone
- Synthesised in hypothalamus
- Secreted by post pituitary
- ↑ water permeability of CD luminal membrane → ↑ water reabsorption
- Acts via cAMP → insert aquaporin 2 channel
- At high concs acts as vasoconstrictor
- ↓ RBF
- ↓ GFR
- Secretion stimulated by
- hypovolaemia > 5-10% change (low P barorec)
- hypotension (high P barorec)
- Ang II
Atrial Natriuretic Factor
- Produced in right atrium in response to ↑ stretch
- Relax glomerular mesangial cells → ↑ GFR
- v/d aff and v/c eff arterioles → ↑ GFR
- ↓ ADH release, ↓ aldosterone
- Inhibit Ang II
Sympathetic Innervation to kidneys
- Causes vasoconstriction ↓ RBF and ↓ GFR
- Stimulates renin release
Shock
Definition
- Shock is state of circulatory failure that results in inadequate organ perfusion and tissue oxygenation
Classification
- Hypovolaemic
- Cardiogenic
- Distributive
- Septic
- Neurogenic
- Obstructive
Haemorrhagic Shock
| CLASS I | CLASS II | CLASS III | CLASS IV | |
|---|---|---|---|---|
| Blood Loss (ml) | < 750ml | 750-1500ml | 1500-2000ml | > 2000ml |
| (% blood vol) | < 15% | 15-30% | 30-40% | > 40% |
| Pulse Rate (bpm) | < 100 | 100-120 | 120-140 | > 140 |
| Blood Pressure | Normal | Normal | ↓ | ↓ |
| Pulse Pressure | Normal/↑ | ↓ | ↓ | ↓ |
| Respiratory Rate | 14-20 | 20-30 | 30-40 | > 35 |
| Urine Output | > 30ml/hr | 20-30ml/hr | 5-15ml/hr | Negligible |
| Mental State | Slightly anxious | Mildly anxious | Anxious, confused | Confused, lethargic |
| Fluid Resus | Crystalloid | Crystalloid | Crystalloid, blood | Crystalloid, blood |